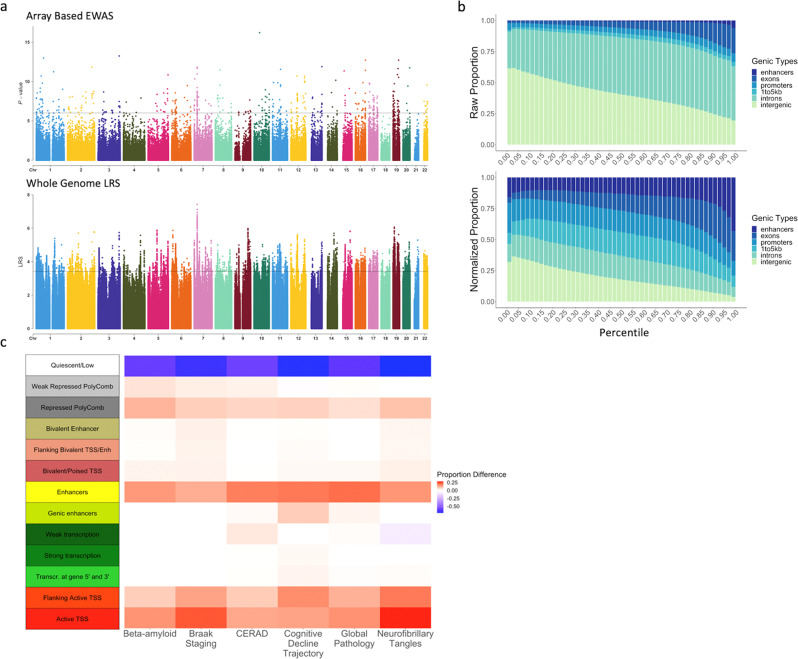
Fig. 3. Genome-wide prediction results.
a Manhattan plots for neurofibrillary tangles: the top panel is for on-450K CpGs with EWAS p-values and the bottom panel is for whole-genome CpGs with imputed LRS by EWASplus. The y-axis is the log-scale rank scores. The top-ranked CpG has the LRS of 7.42 (about empirical p-value of 3.8 × 10⁻⁸); the top 100th ranked CpG has the LRS of 5.42 (about empirical p-value of 3.8 × 10⁻⁶) and the top 10,000th ranked CpG (about empirical p-value of 3.8 × 10⁻⁴) has the LRS of 3.42. b Raw and normalized stacked-proportion histograms for different genomic annotation types. Source data are provided as a Source data file. c The difference of observed and expected chromatin states proportion for the top 10,000 loci across the six AD-related traits: Beta-amyloid, Braak staging, CERAD, cognitive trajectory, global pathology, and neurofibrillary tangles. Source data are provided as a Source data file. The annotated chromatin states are from Roadmap Epigenetics Project and we used the core 15-state model chromatin states for the dorsolateral prefrontal cortex tissue type. To minimize ambiguity, we require only a single annotation type is assigned for each CpG site. if a CpG has multiple annotations, we only record the most “significant” annotation with the following order: enhancer > promoter > exon > intron > near gene (1–5 kb to the TSS) > intergenic. We do not list 5′ UTR and 3′ UTR since these two types are within the first and last exon of each gene according to the UCSC annotation system.

