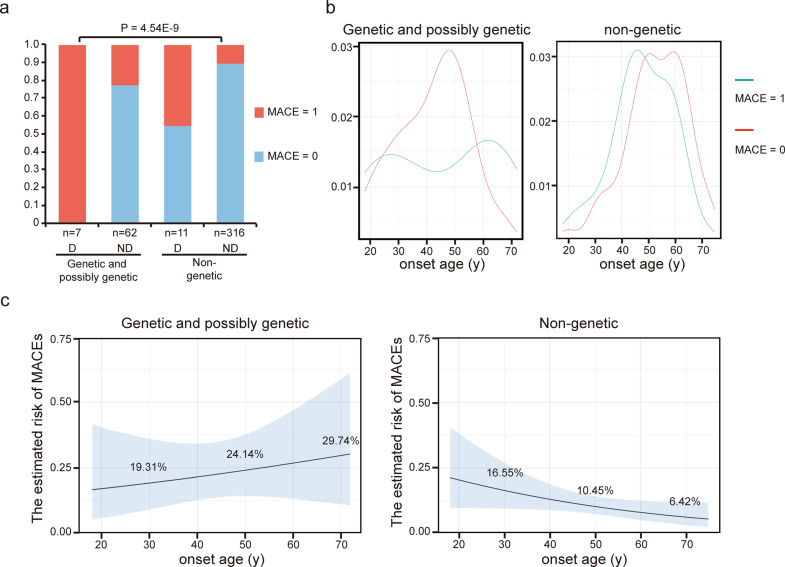
Fig. 3. Predictors for the risk of MACEs.
a Proportions of patients with/without MACE in different groups divided by genetic status and initial dissection. D with initial dissection; ND without initial dissection. b Density plots of onset age for (possibly) genetic cases and non-genetic cases without initial dissection. c Probability of MACE during follow-up of median 55 months based on onset age estimated by logistic regression models. Gray bands indicate 95% confidence intervals.

