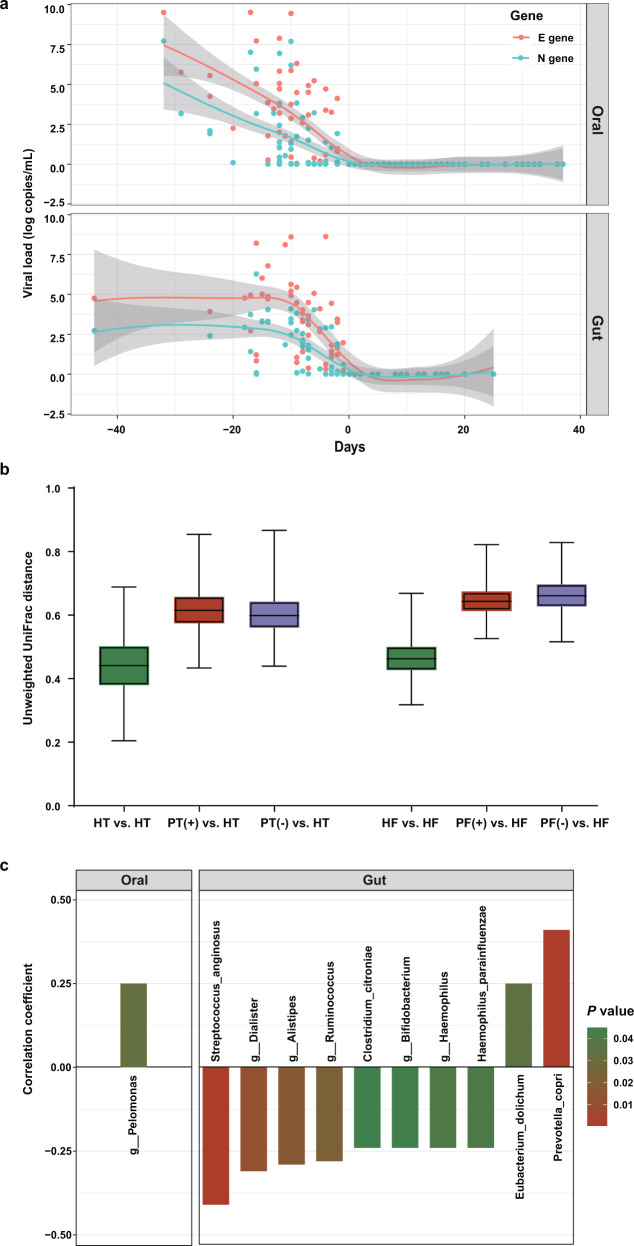
Fig. 4. Associations between oral/gut microbiota disturbance and SARS-CoV-2 viral loads in hospitalized patients.
a Longitudinal changes of viral loads in throat swab samples and fecal specimens from COVID-19 patients. Day 0 indicated the negative conversion time of SARS-CoV-2 RNA. The red line and blue line indicated longitudinal changes in viral loads represented by the abundances of the E gene and N gene, respectively. b Boxplots showing unweighted UniFrac distances within and between groups. c The longitudinal viral load represented by the abundances of the E gene significantly correlated with the timepoint-matched relative abundances of different taxa in throat swab and fecal samples separately. p-values were obtained using CCLasso.

