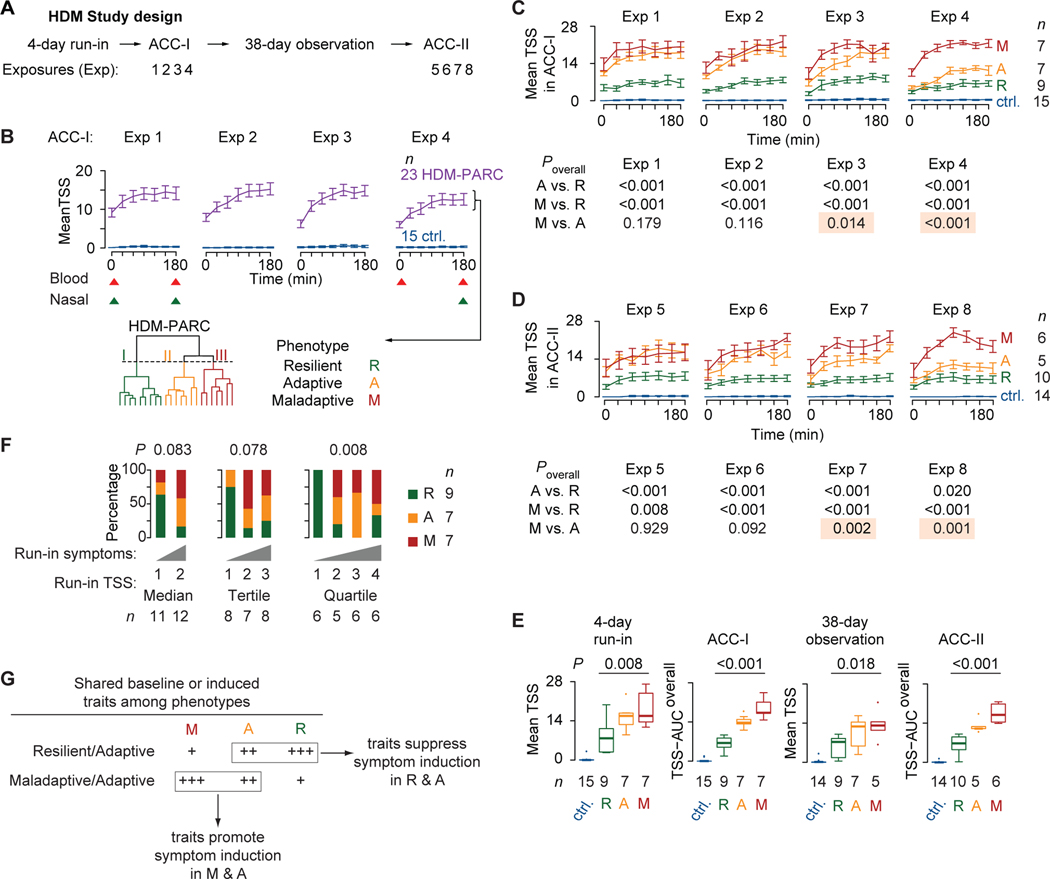
Figure 2. Study design and HDM-PARC phenotypes.
(A) Study design. (B) Top: Mean (SEM) total symptom score (TSS) in controls (ctrl.) and HDM-PARC participants during exposures (Exp) 1–4 in ACC-I; triangles indicate sampling (red, blood; green, nasal brushing). Bottom: Hierarchical clustering of all 28 ACC-I TSS recordings in HDM-PARC participants identified three phenotypes. (C) ACC-I mean (SEM) TSS in controls and HDM-PARC participants stratified by phenotypes (resilient [R], adaptive [A], maladaptive [M]). (D) ACC-II (Exp 5–8; panel A) mean (SEM) TSS in controls and HDM-PARC participants stratified by R, A, or M phenotypes. (E) Mean TSS in the 4-day run-in and 38-day observation phases, and TSS-area under the curve overall (TSS-AUCoverall) in ACC-I and ACC-II in controls and HDM-PARC participants stratified by R, A, or M phenotypes. (E) P, determined by likelihood ratio test. (F) Proportion of participants with each of the HDM-PARC phenotypes according to whether their 4-day run-in average TSS recordings were above (1st) or below (2nd) the median, classified to the 1st, 2nd, or 3rd tertiles, or the 1st, 2nd, 3rd, or 4th quartiles. P, determined by Fisher’s exact test. (G) Model of shared traits among the HDM-PARC phenotypes. Methods for deriving significance values in Supplement.

