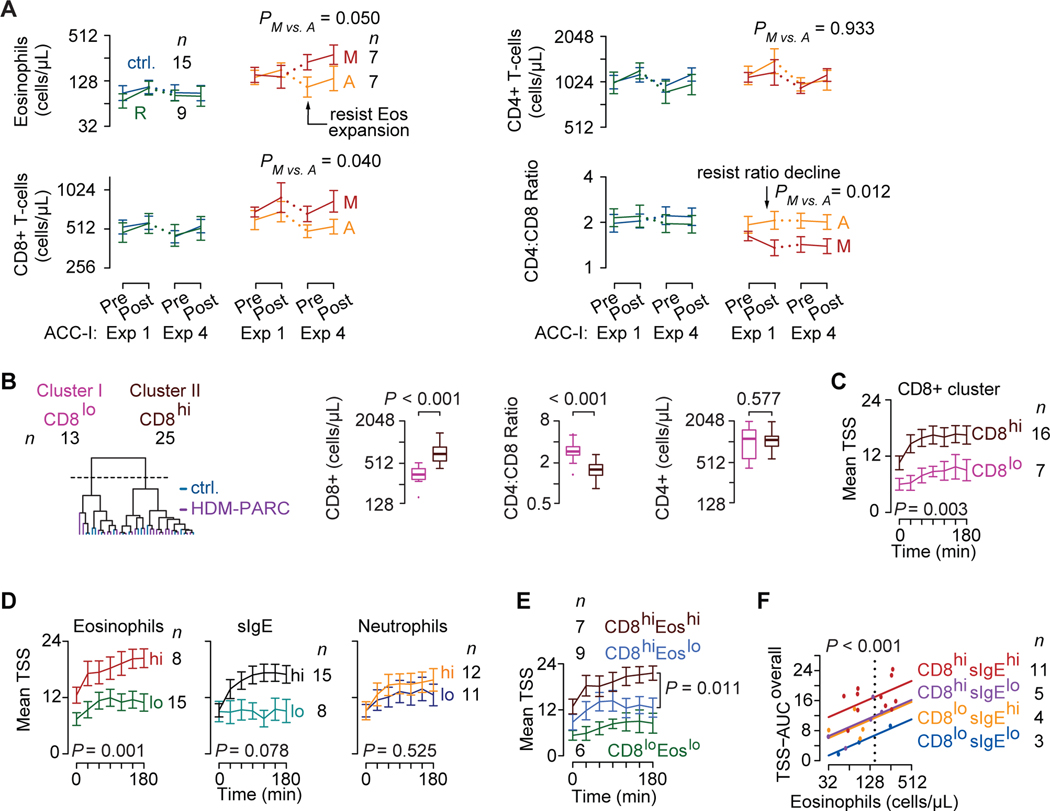
Figure 3. Peripheral blood traits and HDM-PARC symptom severity in the ACC.
(A) Trajectories of log2 cell counts of eosinophils (Eos), CD8+ T-cells, CD4+ T-cells, and the CD4:CD8 ratio at pre- and post-exposure (Exp) 1 and 4 in controls (ctrl.) and HDM-PARC participants stratified by phenotypes (resilient [R], adaptive [A], maladaptive [M]). (B) Left: CD8-CD4 balance clusters identified by hierarchical clustering of baseline CD8+ T-cell counts and CD4:CD8 ratio in controls (blue) and HDM-PARC (purple) participants. Right: Baseline CD8+ and CD4+ T-cell counts and CD4:CD8 T-cell ratio stratified by the CD8-CD4 balance clusters. (A-B) Y-axes depicted as exponentiation of log2 scale. (C-E) ACC-I mean (SEM) total symptom score (TSS) during Exp 1 in HDM-PARC participants stratified by (C) CD8-CD4 balance clusters (CD8hi vs. CD8lo), (D) eosinophil (Eoshi vs. Eoslo), HDM-specific IgE (sIgEhi vs. sIgElo), and neutrophil (neutrophilhi vs. neutrophillo) strata, and (E) CD8hiEoshi, CD8hiEoslo, and CD8loEoslo groups; CD8loEoshi not shown (n = 1). (F) TSS-AUCoverall modeled as a function of log2 eosinophil cell counts by CD8+ (CD8-CD4 balance clusters) and sIgE strata in HDM-PARC participants. Hi, higher; Lo, lower. Cutoffs for peripheral blood traits and methods for deriving significance values in Supplement.

