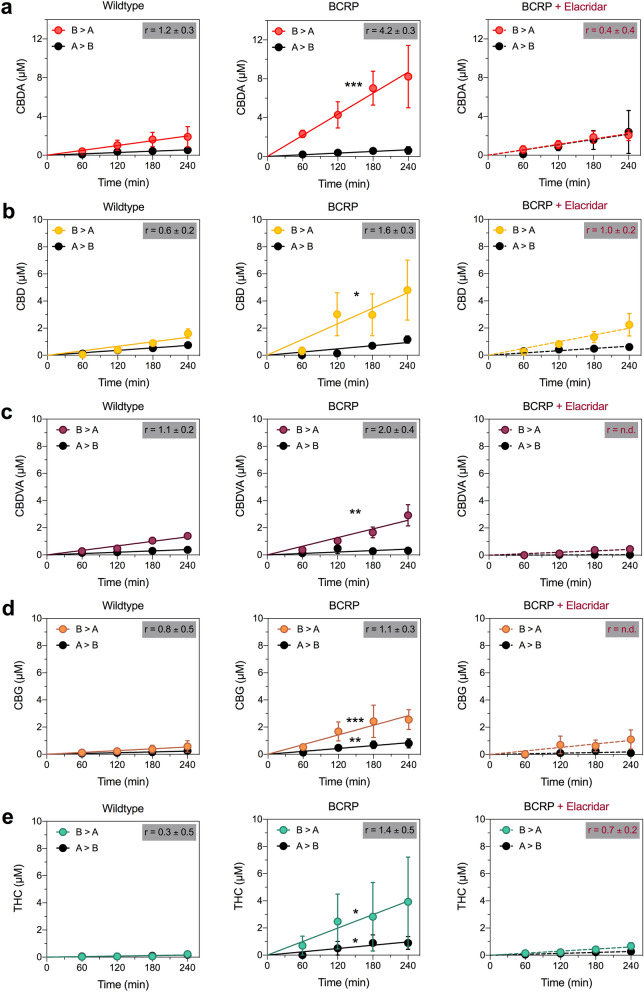
Figure 2.
CBD, CBDA, CBDVA, CBG and Δ9-THC are substrates of BCRP. Concentration–time curves for (a) CBDA, (b) CBD, (c) CBDVA, (d) CBG and (e) Δ9-THC in wildtype (left panel) and BCRP-expressing (middle panel) MDCK cells in the basolateral to apical (B > A) and apical to basolateral (A > B) directions. Right panels represent concentration–time curves for cannabinoids in cells expressing BCRP in the presence of the inhibitor elacridar (dashed lines). Data are expressed as means ± SEM, with n = 4 per time point. Curves represent fits to a linear regression and transport efflux ratios (r) are listed (*p < 0.05, **p < 0.005, ***p < 0.0005 compared to wildtype; Extra sum-of-squares F test).

