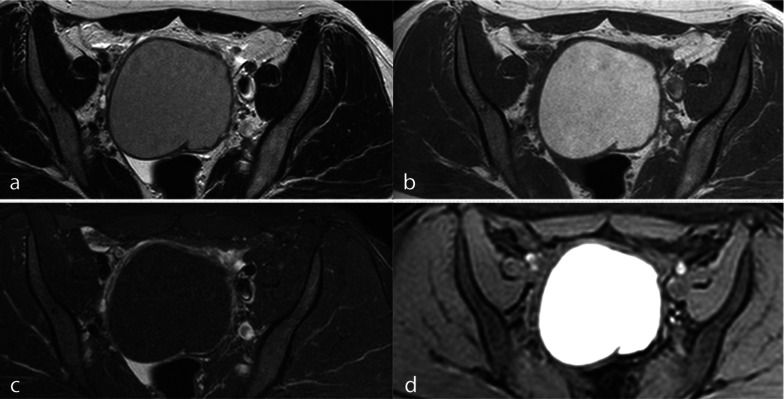
Fig. 2.
OMA mimicking a mature cystic teratoma in a STIR sequence. a TSE T2w axial image, (b) TSE T1w axial image, (c) STIR axial image and (d) THRIVE axial image. The loss of T1w high signal intensity in the STIR image is not specific to fat (c), because endometriomas and fatty tissue may have similar T1 relaxation times. In the THRIVE sequence, on the basis of a spectral saturation of fat, the endometrioma remains hyperintense (d)

