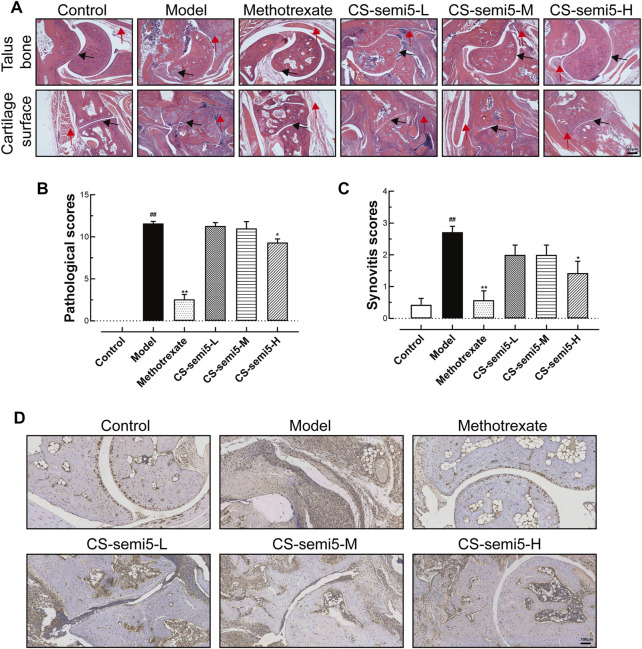
FIGURE 2.
CS-semi5 limits collagen-induced synovium inflammation and inflammatory infiltration in CIA mice. (A) Histologic images of talus bone and cartilage surface of ankle joints stained with H&E (40×magnification). Red arrows indicate synovial lining hyperplasia, inflammatory infiltration and pannus formation, and black arrows indicate invasive phenotype of the synovium. Bar indicates 50 μm. (B) Pathological scores were calculated. (C) The degree of synovitis was semi-quantified based on the synovial lining layers. (D) Representative histologic sections of ankle joints following immunostaining with CD68. CD68+ macrophages stained in dyed brown. Scale bar represents 100 μm n = 7. ## p < 0.01 compared with Control group; *p < 0.05 and **p < 0.01 compared with Model group.

