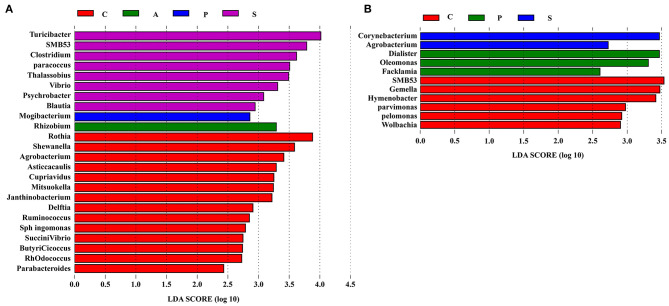
Figure 8.
The differentially abundant taxa among the four groups by LEfSe (LDA Effect Size) analysis. Histograms of a linear discriminant analysis (LDA) score (threshold: ≥ 2) in (A) jejunum and (B) ileum. n = 8 per group. C, control group; A, antibiotic group; P, probiotic group; and S, synbiotic group.

