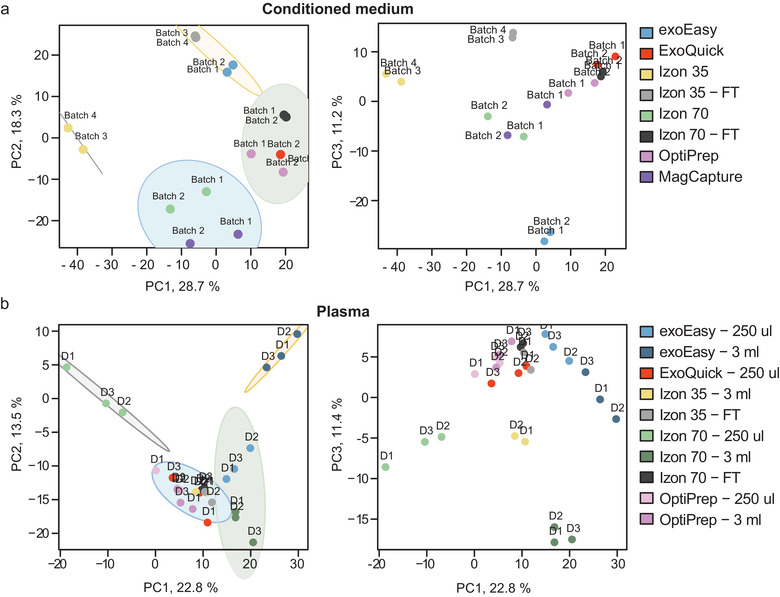
FIGURE 6.

Different isolation methods result in diverse EV samples. Principal Component Analysis (PCA) was performed on the identified proteins by mass spectrometry. The variance contained by the stated PC is shown as percentage, ellipses represent 95% CI. (a) PCA on proteins identified in the conditioned medium samples. The first plot shows PC1 versus PC2 and the second plot shows PC1 versusversus PC3. (b) PCA on proteins identified in the plasma samples. The first plot shows PC1 versus PC2 and the second plot shows PC1 versus PC3.
