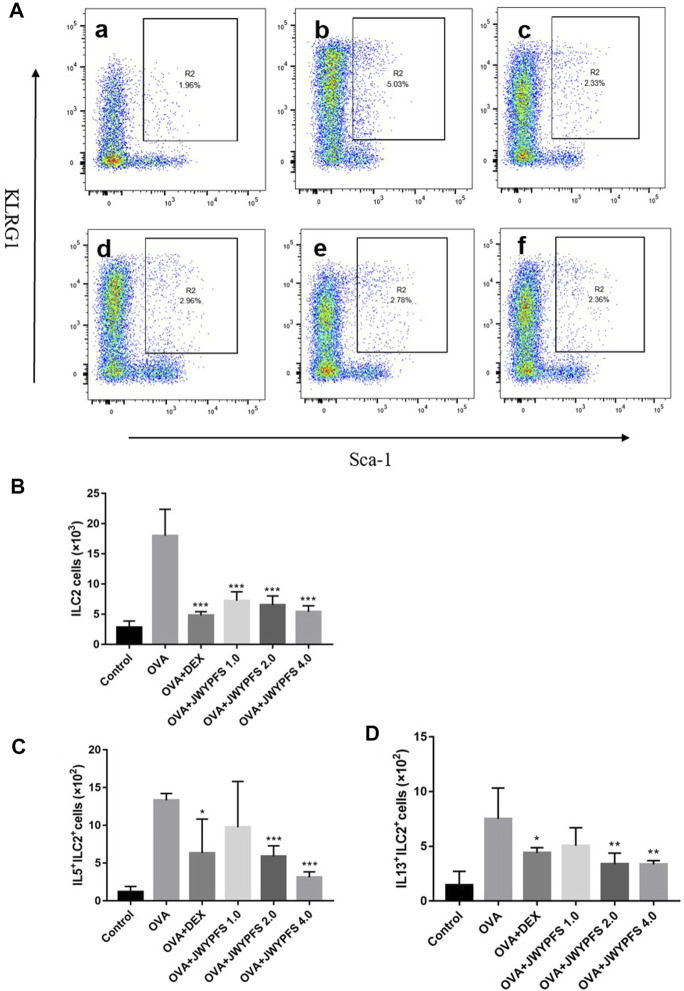
FIGURE 4.
The effect of JWYPFS on ILC2s in lung tissue. (A) Flow cytometric analysis of the percentage of CD45+Lineage−Sca-1+KLRG1+ ILC2s in each group. a: control; b: OVA; c: OVA + DEX; d: OVA + JWYPFS 1.0; e: OVA + JWYPFS 2.0; f: OVA + JWYPFS 4.0. (B) Cell numbers of ILC2s in lungs. (C) IL5+ILC2s in lungs. (D) IL13+ILC2s in lungs. Data are shown as mean ± SD. *p < 0.05, **p < 0.01, ***p < 0.001, compared with OVA group.

