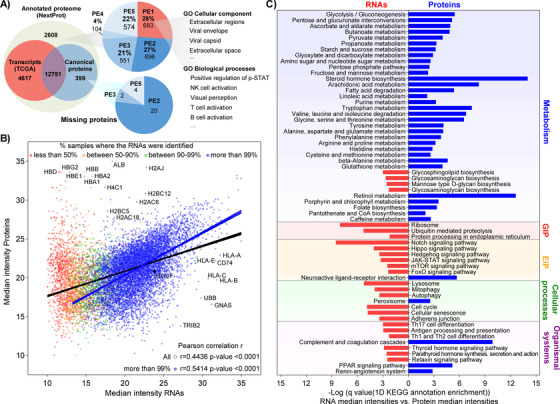
FIGURE 3.

Comparison of MM500 melanoma proteome, TCGA melanoma transcriptome, and the Human proteome. (A) Overlapping of transcripts (TCGÀ), identified melanoma protein‐coding genes (canonical proteins) and the human proteome (NextProt). In NextProt, proteins are categorized in a PE1‐PE5 structure, in acceptance within the scientific community (https://www.uniprot.org/help/protein_existence), 114 with five types of evidence for the existence of a protein: (1) experimental evidence at protein level; (2) experimental evidence at transcript level; (3) protein inferred from homology; (4) protein predicted; (5) protein is uncertain. (B) Correlation relationships between mRNA and mean protein expressions. Scatter plot of median intensity of the proteins identified in this study versus the median intensity of transcripts coming from RNA sequencing data from 443 melanoma tumors downloaded from the TCGA repositories. RNA sequencing data were classified according to the number of samples where the transcript was detected. The Pearson correlation and best‐fitting curve were provided for the whole dataset and those transcripts quantified in more than 99% of the samples. Both datasets were scaled to the range between 10 and 35. (C) Representation of the 1D KEGG annotation enrichment of the differences between the median intensity in all samples of the transcripts and the proteins. Bars indicate the level of enrichment according to a Benjamini‐Hochberg FDR truncation strategy. Blue correspond to pathways overrepresented for proteins relatively more abundant than their transcripts and Red bars correspond to pathways overrepresented in those transcripts showing relatively more abundance than their corresponding protein. Pathways were sorted based on their KEGG classification. The 1D annotation enrichment analysis was performed under the Perseus platform
