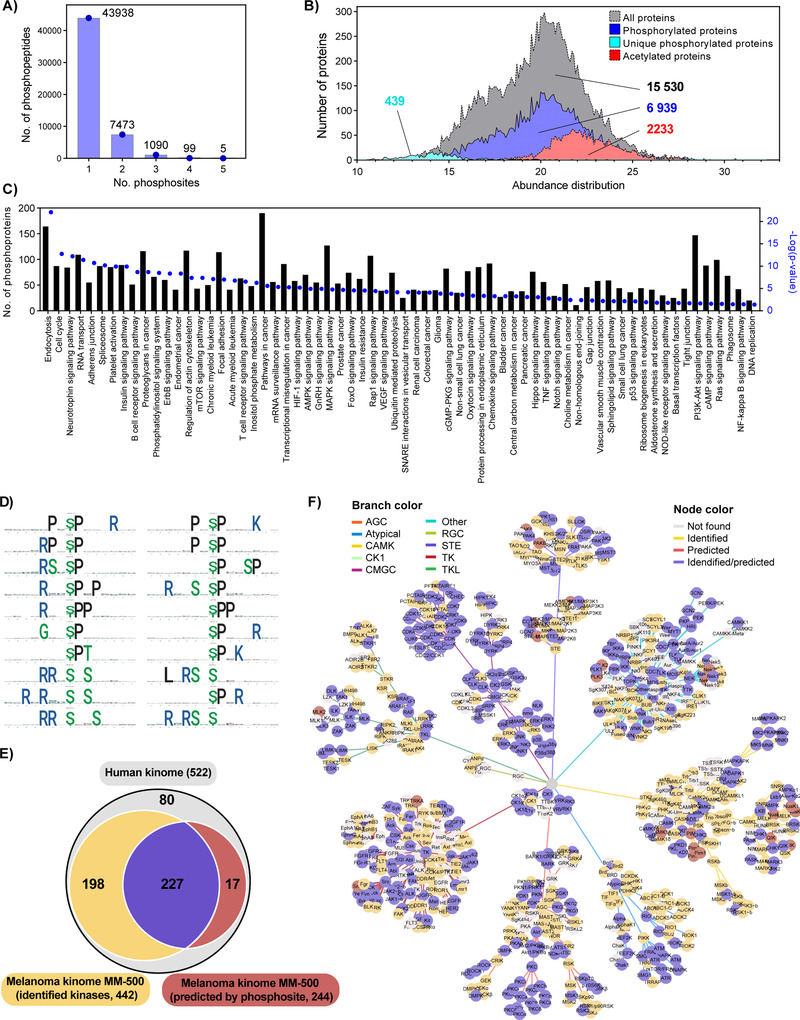
FIGURE 5.

Melanoma phosphoproteome and kinome analysis. (A) Number of identified mono‐, di‐ and multiphosphorylated peptides. (B) Abundance distribution of the melanoma proteome phosphoproteome and acetylome. The relative abundance of the proteins was calculated based on the quantitative proteomic data, with the exception of the 439 proteins that were only detected after phosphopeptide enrichment. In that case the abundance was calculated from the phosphopeptides identified. (C) Distribution of the melanoma phosphoproteome based on enriched KEGG pathway analysis. (D) First 20 phosphorylation motifs in the output list of the motifeR software. (E) Venn diagram of the melanoma kinome comprising the kinases directly identified in this meta‐study and kinases predicted based on detection of phosphorylation motifs of identified phosphosites, both covering a comprehensive part of the human kinome. (F) Kinome network mapping based on direct identification of kinases and computational kinase‐specific phosphorylation site prediction. Kinases identified, predicted, identified/predicted, and not found have different color nodes and are clustered in different categories based on the branch color
