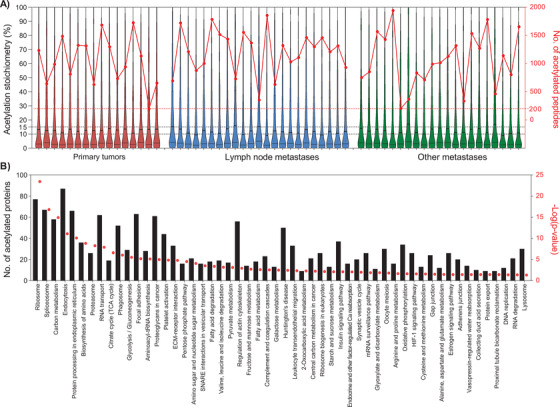
FIGURE 6.

Distribution of the acetylome identified in melanoma tumors. (A) Violin plots showing the distribution of the site‐specific acetylation occupancy (acetylation stoichiometry [%], left axis) of peptides in the 60 samples submitted to acetylome analysis. The samples were grouped according to their origin: primary tumors (red), lymph node (blue), and other metastases (green). The number of acetylated peptides identified in each sample is represented with red dots and connected lines within origin based groups (no. of acetylated peptides, right axis). (B) KEGG pathways significantly enriched in the melanoma acetylome. Bars correspond to the number of acetylated proteins involved in the annotated pathway. The enrichment –log(P value) represented as red dots was plotted for each pathway annotation (right axis)
