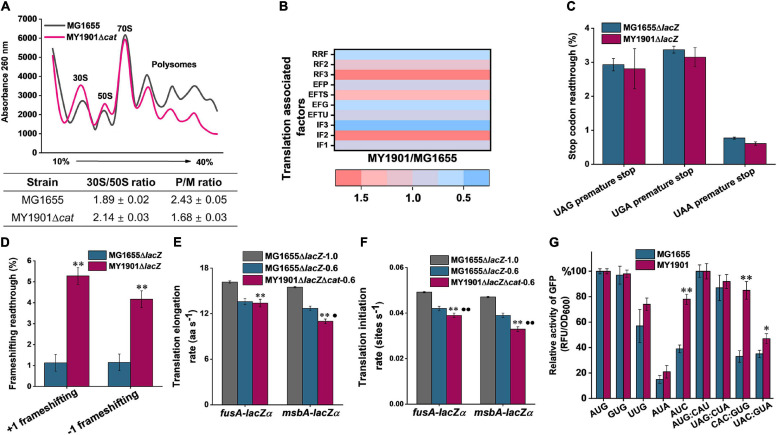
FIGURE 3.
Effects of SRP suppressor on translation efficiency. (A) Polysome profiles of the wild-type strain MG1655 and the suppressor strain MY1901Δcat. Data represent the mean ± standard deviation of three independent experiments. (B) Fold changes in the expression of translation associated factors in strain MY1901relative to that in MG1655 (Supplementary Data Set 1B). (C,D) Effect of suppressor mutation on stop-codon (C) and frameshifting (D) readthrough. All data are averages of at least three independent experiments, and error bars represent the standard deviation of the mean. b-Galactosidase activities of strains harboring the mutant LacZ reporters were calculated relative to those of the same strain harboring the wild-type LacZ. Statistical significance compared to the suppressor strain MY1901Δcat using Student’s t-test is indicated as follows: *P < 0.05; **P < 0.01. (E) The translation elongation rates of FusA-LacZα and MsbA-LacZα under different growth rates (MG1655ΔlacZ, 1.0 h– 1; MG1655ΔlacZ, 0.6 h– 1; MY1901ΔlacZΔcat, 0.6 h– 1). (F) The translation initiation rate of proteins was estimated based on their corresponding translation elongation rate. All data are averages of three independent experiments, and error bars represent the standard deviation of the mean value. Statistical significance compared to the strain MG1655ΔlacZ with growth rate 1.0 h– 1 using Student’s t-test is indicated as follows: *P < 0.05; **P < 0.01. Statistical significance compared to the strain MG1655ΔlacZ with growth rate 0.6 h– 1 using Student’s t-test is indicated as follows: *P < 0.05; **P < 0.01. (G) Initiation with various non-canonical start codons and non-initiator tRNA codons in the wild-type and suppressor strains. Relative activities of mutant GFP were calculated relative to that of the same strain harboring the wild-type GFP. The wild-type start codon was indicated as AUG, and the wild-type initiator tRNA was indicated as AUG: CAU. All data are averages of three independent experiments, and error bars represent the standard deviation of the mean value. Statistical significance compared to the strain MG1655 using Student’s t-test is indicated as follows: *P < 0.05; **P < 0.01.

