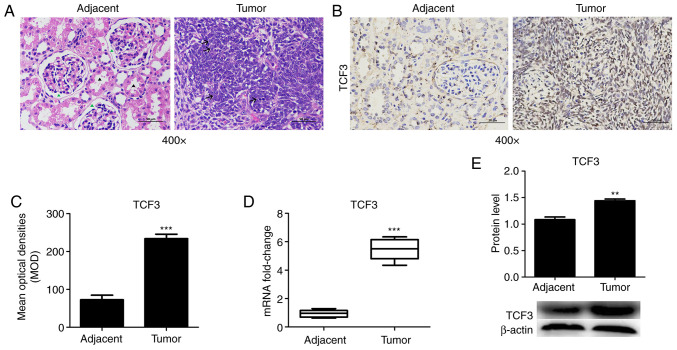
Figure 1.
TCF3 expression in WT tissues. WT tissues and adjacent tissues were collected to detect the expression levels of TCF3. (A) Hematoxylin and eosin staining of WT and adjacent tissues (scale bar, 50 µm). The glomerulus (green arrowhead) and kidney tubules (black arrow) were intact in the adjacent tissue group. Tumor cells in the WT tissue were diffuse or patchy and cells appeared short fusiform or elliptical with partially deviated nucleoli (arrow). (B) TCF3 expression in WT and adjacent tissues determined by immunohistochemistry (scale bar, 50 µm). (C) MOD of TCF3 was semi-quantified using ImageJ2 software. (D) Reverse transcription-quantitative PCR and (E) western blotting were performed to detect the mRNA and protein expression levels of TCF3. All experiments were repeated at least three times. Data are presented as the mean ± standard error of the mean and were analyzed via Student's t-test. **P<0.01 and ***P<0.001 compared with the adjacent tissue group. MOD, mean optical density; TCF3, T-cell factor 3; WT, Wilms' tumor.

