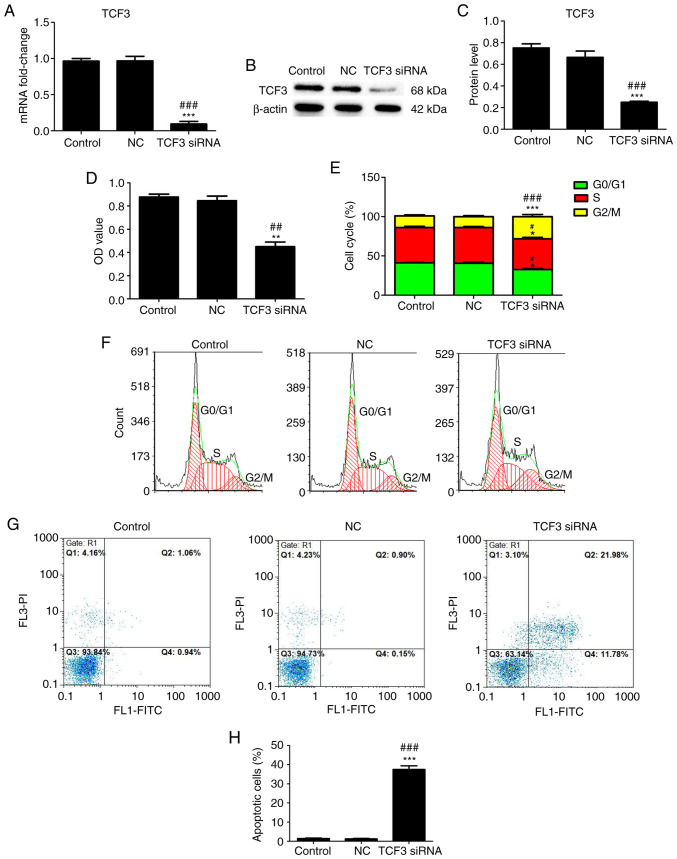
Figure 2.
Effect of TCF3 silencing on the viability, cell cycle progression and apoptosis of G401 kidney tumor cells. Reverse transcription-quantitative PCR (A) and western blotting (B) were performed to detect the mRNA and protein expression levels of TCF3 in all groups. (C) Semi-quantification of western blotting was performed using ImageJ2 software. (D) MTT assays were performed to detect viability. (E) Cell cycle distribution was determined. The effect of TCF3 silencing on the (F) cell cycle progression and (G) apoptosis of G401 kidney tumor cells were examined via flow cytometry. (H) Percentage of apoptotic cells was quantified. Control group, untransfected cells; NC group, cells transfected with NC siRNA; TCF3 siRNA group, cells transfected with TCF3 siRNA. All experiments were repeated at least three times. Data are presented as the mean ± standard error of the mean and were analyzed via one-way ANOVA with Tukey's post hoc test. *P<0.05, **P<0.01 and ***P<0.001 compared with the control group; #P<0.05, ##P<0.01 and ###P<0.001 compared with the NC group. FITC, fluorescein isothiocyanate; NC, negative control; OD, optical density; PI, propidium iodide; siRNA, small interfering RNA; TCF3, T-cell factor 3.

