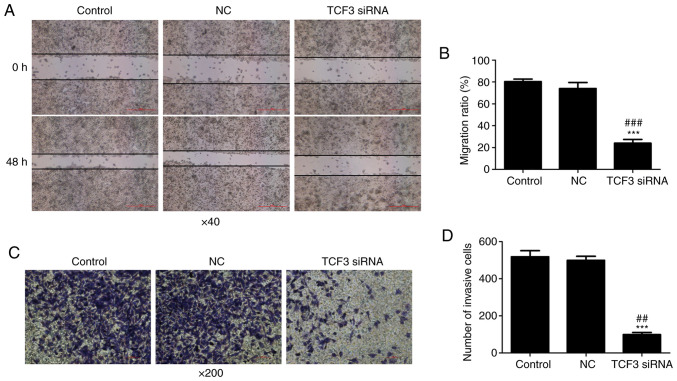
Figure 3.
Effect of TCF3 silencing on G401 kidney tumor cell migration and invasion. (A) Cell migration was detected using a wounding-healing assay (scale bar, 500 µm). (B) Migration ratio was calculated. (C) Cell invasion was detected using a Transwell assay (scale bar, 100 µm). (D) Cells were stained with crystal violet and number of invasive cells was assessed. Control group, untransfected cells; NC group, cells transfected with NC siRNA; TCF3 siRNA group, cells transfected with TCF3 siRNA. All experiments were repeated at least three times. Data are presented as the mean ± standard error of the mean and were analyzed via one-way ANOVA with Tukey's post hoc test. ***P<0.001 compared with the control group; ##P<0.01 and ###P<0.001 compared with the NC group. NC, negative control; siRNA, small interfering RNA; TCF3, T-cell factor 3.

