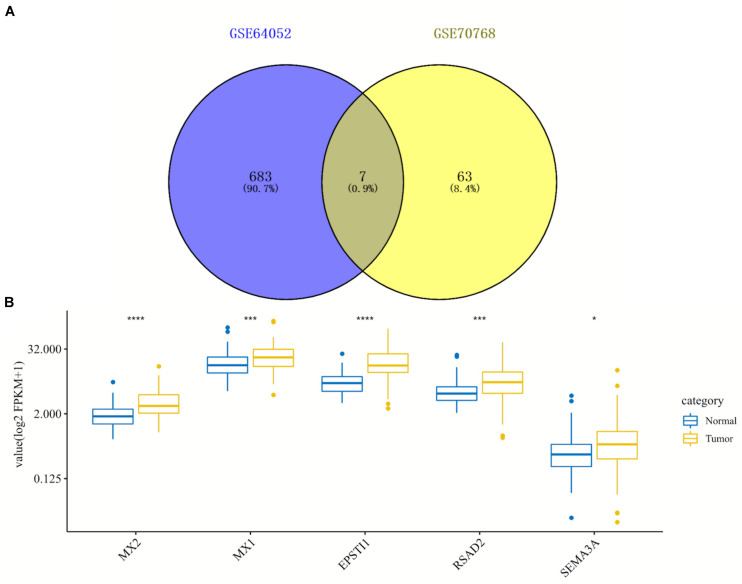
FIGURE 3.
Identification and expression analysis of five hub genes in normal/tumoral tissues. (A) Venn diagram of seven overlapping genes by comparing differentially expressed genes (DEGs) from two datasets. (B) Box plot of expression of five hub genes in normal and tumoral tissues in TCGA database. DEGs, differentially expressed genes; TCGA, The Cancer Genome Atlas. *p < 0.05; ***p < 0.001; ****p < 0.0001.

