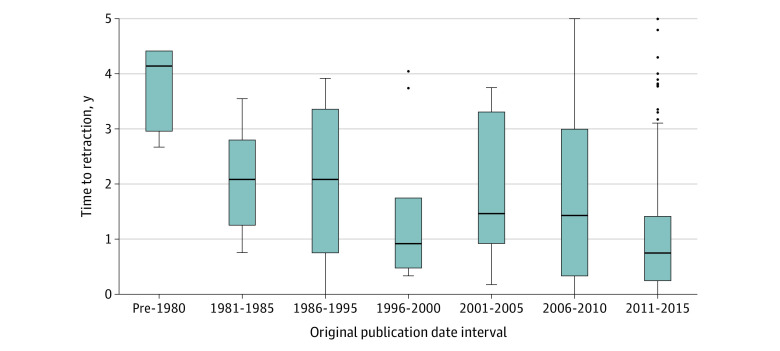
Figure. Effect of Article Publication Date on Time to Retraction.
Grouped boxplots of time between original publication and official retraction show a trend toward more rapid retractions for more recently published articles. Two 5-year intervals (ie, 1986-1990 and 1991-1995) were merged as each interval contained 2 data points after applying inclusion criteria, which was too few for analysis. The height of the box represents the interquartile range (IQR), the horizontal line in the box represents the median, the whiskers represent the 1.5 IQR of the 25th quartile or the 1.5 of the 75th quartile. The dots represent outliers.

