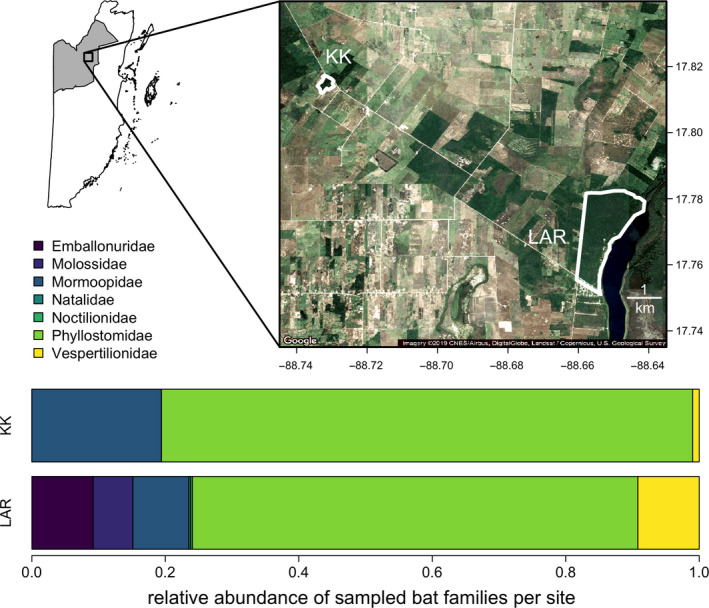
Figure 1.

Study sites in northern Belize. The shaded inset shows the location of Orange Walk District. Borders show the boundaries of the LAR (Lamanai Archaeological Reserve) and KK (Ka’Kabish). White and brown shading indicates agricultural and urban development, while dark green shading represents intact forest. Satellite imagery was derived from Google Maps. Stacked bar plots show the relative abundance of each sampled bat family per study site [Colour figure can be viewed at wileyonlinelibrary.com]
