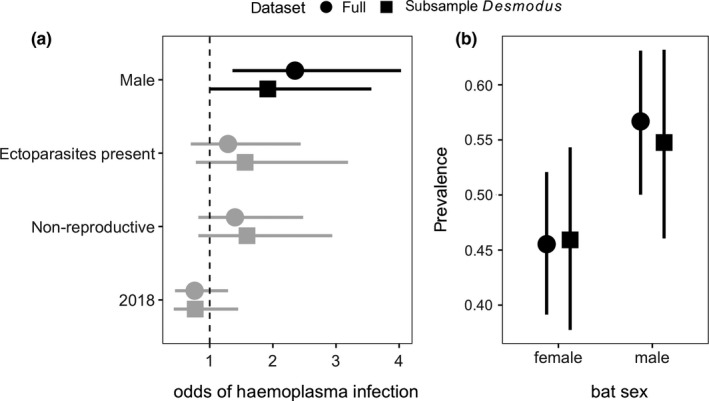
Figure 2.

Predictors of individual bat haemoplasma infection status. (a) Odds ratios and 95% HDIs from the most parsimonious phylogenetic GLMM (Table S4). Estimates that do not overlap with 1 (dashed line) are displayed in black. Reference levels for the odds ratios include bats sampled at LAR, females, reproductive bats, absence of ectoparasites and bats sampled in 2017. (b) Infection prevalence and 95% confidence intervals (Wilson method) stratified by sex. Results are shown for the full data set and after randomly subsampling Desmodus rotundus
