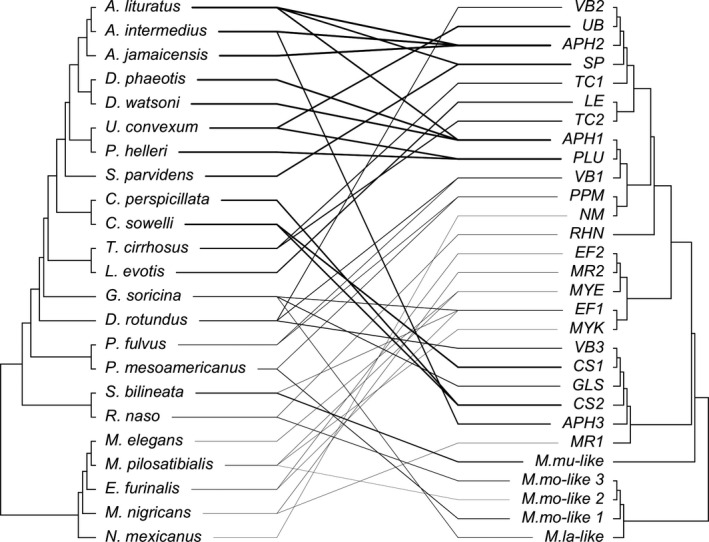
Figure 4.

Evolutionary relationships between Belize bats and haemoplasma genotypes. The cophylogeny plot shows the bat phylogeny on the left and the haemoplasma genotype phylogeny on the right. We used the treespace package to collapse our complete haemoplasma phylogeny (Figure S3) to only the 29 bacterial genotypes (Jombart, Kendall, Almagro‐Garcia, & Colijn, 2017). Lines display bat–haemoplasma associations and are shaded by the inverse of the squared residuals from PACo (i.e., dark lines show small residuals more indicative of coevolution)
