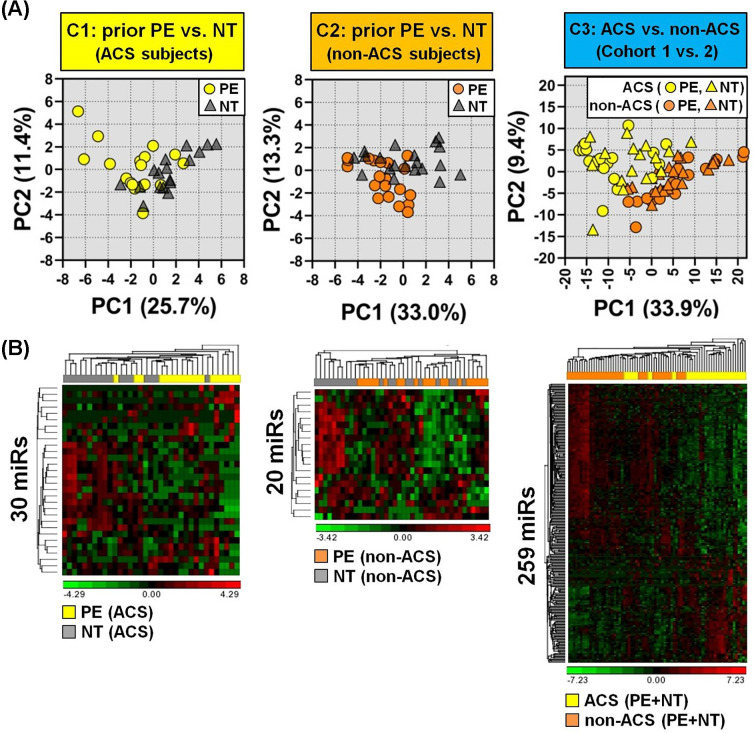
Figure 2. Principal component analysis (PCA) and hierarchical clustering of miRNAs associated with a history of PE or current ACS exposure.
(A) PCA of 30 differentially altered miRs (P < 0.05) in ACS cohort 1 (n = 17–18 subjects/group), 20 altered miRs (P < 0.05) in non-ACS cohort 2 (n = 20 subjects/group), and 259 altered miRs (FDR < 0.05) in cohort 3 comparing ACS versus non-ACS subjects (n = 35–40 /group). (B) Unsupervised hierarchical clustering and heatmap of plasma levels of differentially altered miRNAs for each exposure. Rows denote miRNAs and columns denote subjects. High and low relative plasma levels are denoted by red and green, respectively. Log2 transformed TMM-normalized miRNA counts (offset 1) were used for PCA, and further shifted to mean 0 and scaled to a standard deviation of 1 for clustering and heatmap construction.

