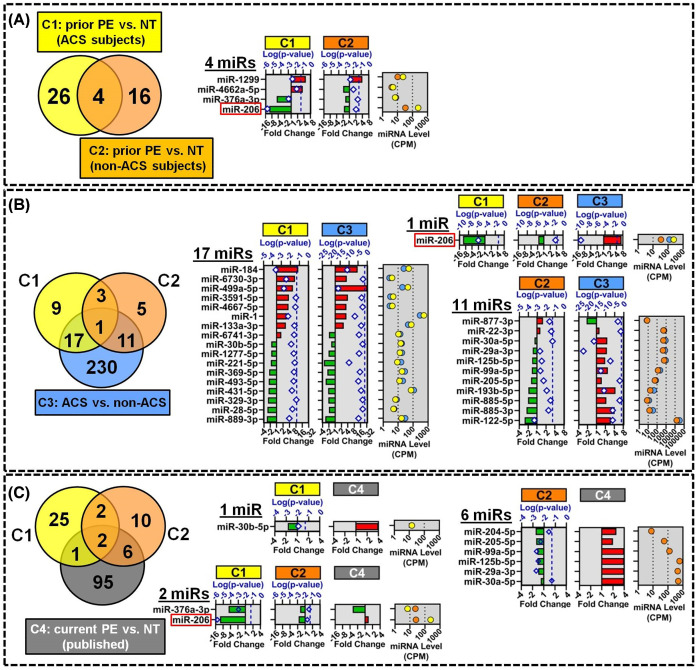
Figure 3. Overlap and identity of circulating miRNAs associated with prior PE or current ACS exposure.
(A) Venn diagram shows the overlap between 30 and 20 miRNAs that were differentially altered (P < 0.05) between women with history of PE versus NT pregnancy in cohorts 1 (n = 17–18/group) and 2 (n = 20/group), respectively. Right panel shows the identity of the 4 overlapping miRNAs with their direction and magnitude of change (bottom axis scale) and log10 transformed P-values (diamonds, top axis scale) separated by exposure cohort (ACS cohort 1, C1; non-ACS cohort 2, C2). Dashed vertical line denotes P = 0.05 threshold. Plasma miRNA levels are shown as mean counts per million mapped reads (CPM). Identities of all miRNAs and FDR-adjusted p-values are shown in Supplementary Table S4. (B) Venn diagram shows overlap among differentially altered miRNAs associated with prior PE in ACS subjects (C1: 30 miRs P < 0.05), prior PE in non-ACS subjects (C2; 20 miRs P < 0.05), and current ACS exposure (C3; 259 miRs FDR < 0.05, n = 35–40/group). Right panels show the identity, fold-change, P-values and CPM plasma level for miRNAs that intersect multiple exposure comparisons. Identities of all miRNAs and FDR-adjusted P-values are shown in Supplementary Table S5. (C) Venn diagram shows overlap among differentially altered miRNA candidates associated with prior PE in ACS (C1) or non-ACS (C2) subjects, and 104 miRNAs (C4) previously reported to be altered in circulation during PE [10]. Right panels show details on overlapping miRNAs. P-values and CPM levels for previously published data are not shown. Identities of all miRNAs and FDR-adjusted P-values are shown in Supplementary Table S7.

