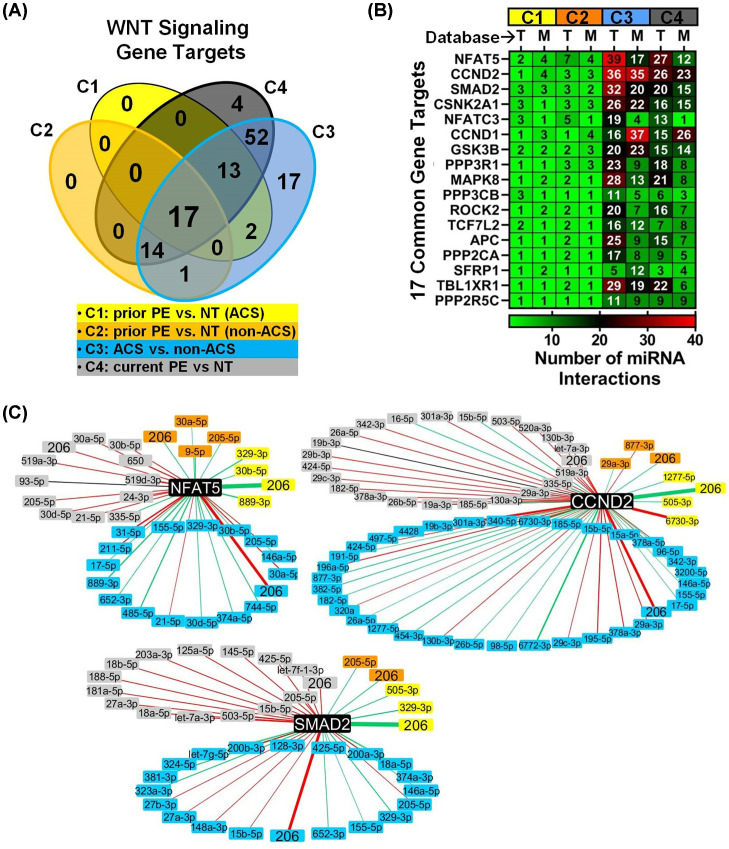
Figure 5. Characterization of miRNA–target gene interactions in Wnt signaling associated with PE and ACS.
(A) Venn diagram showing the number of miRNA target genes related to Wnt signaling that are shared between different exposure cohorts (C1-C4). Only genes that were identified in both TargetScan (T) and miRTarBase (M) databases were included. (B) 17 target genes implicated in Wnt signaling in all 4 exposure cohorts. Heatmap shows the number of miRNAs that target each gene, stratified by database and cohort. (C) MiRNA interactions with three highly networked genes (NFAT5, CCND2 and SMAD2) identified in miRTarBase. Nodes represent differentially altered miRNAs color-coded according to cohort and related target genes (black nodes). Red and green lines denote increased and decreased miRNA plasma levels, respectively. Line thickness is scaled to the magnitude of fold change in miRNA level.

