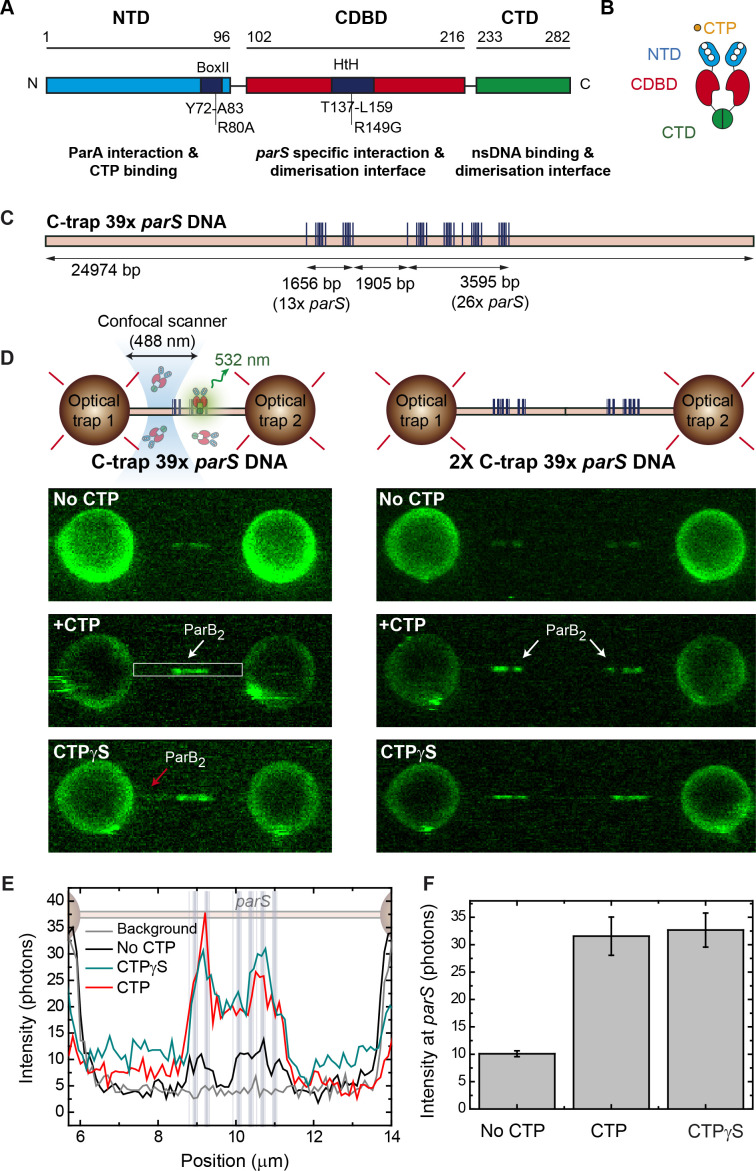
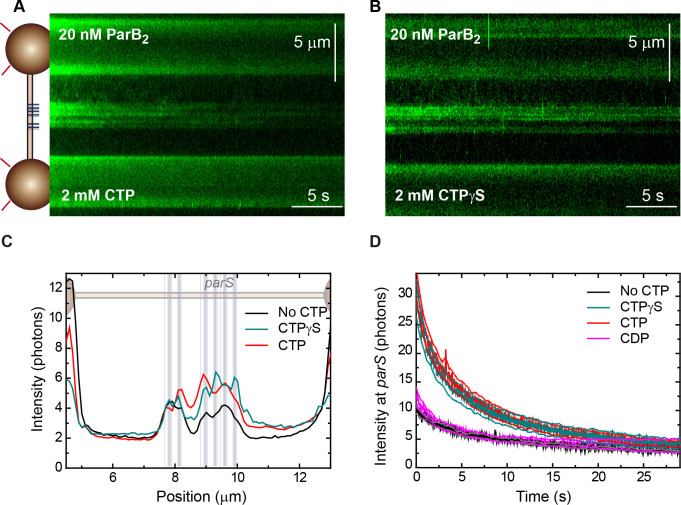
Figure 1. Direct visualization of ParB specific binding to parS sites.
(A) Domains and functional motifs of ParB as reported previously (Bartosik et al., 2004; Kusiak et al., 2011). Mutations R80A, defective for cytidine triphosphate (CTP) binding, and R149G, defective for parS binding, are indicated. (B) ParB dimer cartoon showing dimerization through the central and C-terminal domains. The nucleotide binding site at the N-terminal domain (NTD) is also indicated. (C) Schematic representation of the single-length 39× parS DNA used for C-trap experiments. The DNA contains 39 parS sequences distributed in six groups forming two clusters separated by 1905 bp (39× parS DNA). The positions of the parS sites in the DNA cartoon are represented to scale. (D) Schematic of the C-trap experiment where single and tandem (double-length) tethers are immobilized between two beads and scanned with a confocal microscope using 488 nm illumination (upper part). Representative confocal images of the experiment under no CTP, 2 mM CTP, or 2 mM CTPγS conditions (lower part) and 20 nM ParB2AF488. Dark to bright regions correspond to a scale of 0–30 photon counts for single-length tethers and 0–50 counts for tandem tethers. (E) Representative profiles (500 nm width) of the fluorescence intensity along the DNA axis of the confocal images depicted in D (only single-length tether data). Positions of the parS sequences are included to scale in the background. Brighter regions between the beads correlate with the position of the parS clusters. ParB proteins are also observed outside the parS region (red arrow) and in general the fluorescence intensity outside the parS region is always above the background and larger in CTPγS compared to CTP experiments. (F) Quantification of fluorescence intensity at the parS-containing region under no CTP, CTP, and CTPγS conditions.

