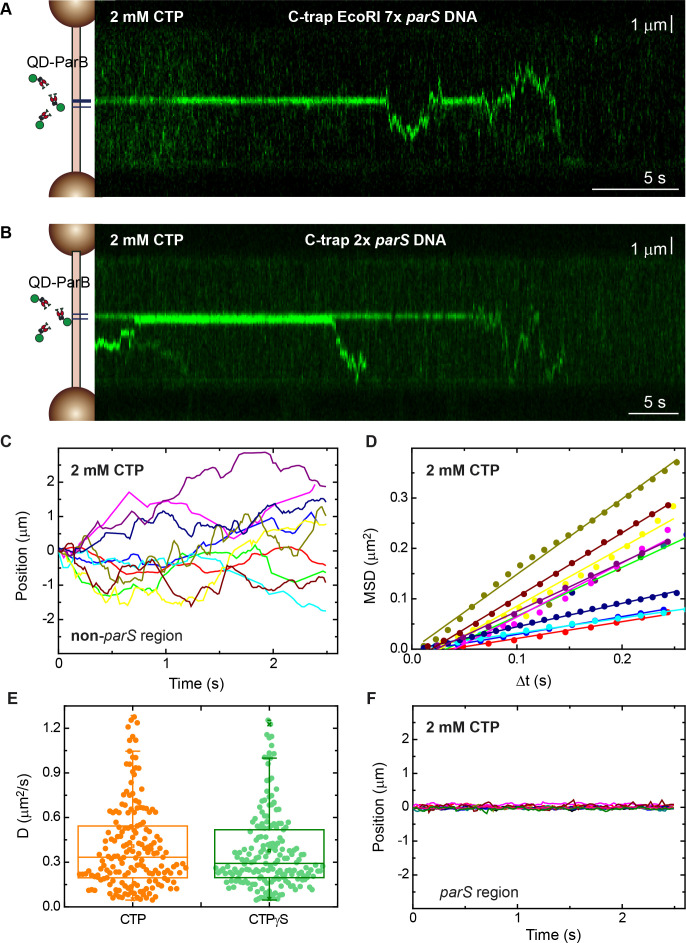
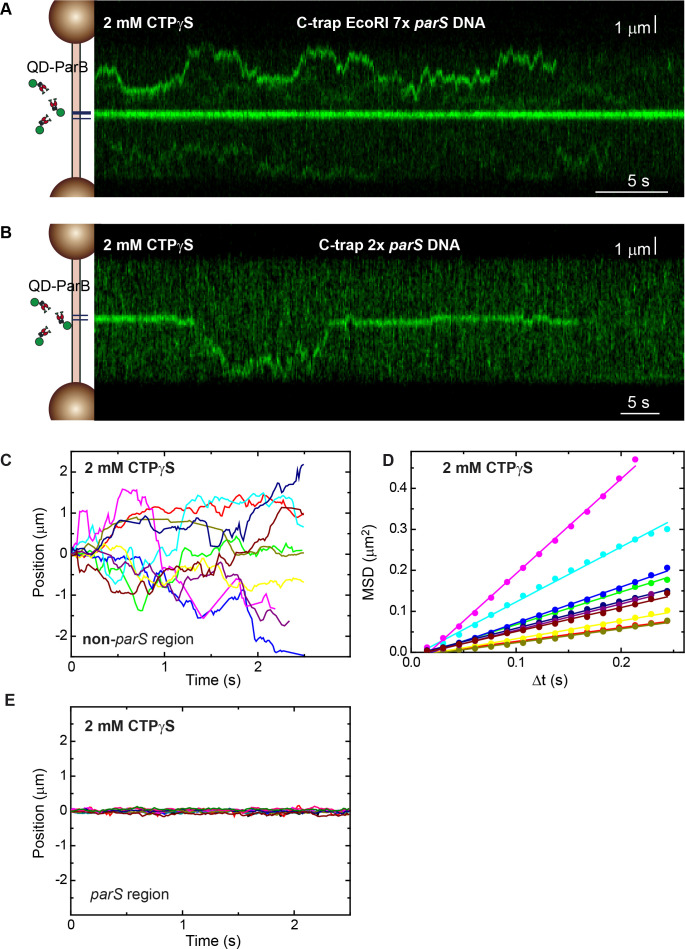
Figure 3. Direct visualization of ParB diffusion from parS sites.
(A) Fluorescence kymograph of quantum dot (QD)-ParB on C-trap EcoRI 7× parS DNA substrates obtained under cytidine triphosphate (CTP)-Mg2+ conditions. ParB remains mostly at parS sites and eventually diffuses from parS. (B) Fluorescence kymograph of QD-ParB on C-trap 2× parS DNA substrates obtained under CTP-Mg2+ conditions. (C) Representative QD-ParB trajectories measured on non-parS regions of DNA (N=177). (D) Mean squared displacement (MSD) of ParB for different time intervals (Δt). Straight lines indicate normal diffusive behaviour. (E) Diffusion constants of ParB calculated as half of the slope of linear fits of MSD versus Δt. (F) Representative QD-ParB trajectories measured on parS regions of DNA indicate ParB remains mostly bound to parS.


