. 2021 Jul 12;10:e67554. doi: 10.7554/eLife.67554

Figure 6. DNA condensation by nanomolar ParB is parS dependent.

(A) ParB does not condense scrambled parS DNA under standard cytidine triphosphate (CTP)-Mg2+ conditions. Errors are standard error of the mean of measurements on different molecules (N = 5). (B) The parS-binding mutant, ParBR149G, does not condense 13× parS DNA under standard CTP-Mg2+ conditions. Errors are standard error of the mean of measurements on different molecules (N = 14). (C) Schematic representation of DNA substrates containing 7, 13, and 26 copies of parS. The positions of the parS sites in the DNA cartoon are represented to scale. (D) Average force-extension curves of 7× parS DNA, 13× parS DNA, and 26× parS DNA obtained under standard CTP-Mg2+ conditions. The condensation force correlates with increasing number of parS sequences. Solid lines in condensed data are guides for the eye. Errors are standard error of the mean of measurements on different molecules (N ≥ 7). (E) Schematic representation of DNA substrates containing 1, 2, and 4 copies of parS. The positions of the parS sites in the DNA cartoon are represented to scale. (F) Average force-extension curves of 1× parS DNA, 2× parS DNA, and 4× parS DNA obtained under standard CTP-Mg2+ conditions. No condensation was observed for these three experiments due to the pulling force present in magnetic tweezers (MT) experiments. Errors are standard error of the mean of measurements on different molecules (N ≥ 7). No ParB data represent force-extension curves of DNA taken in the absence of protein and are fitted to the worm-like chain model.

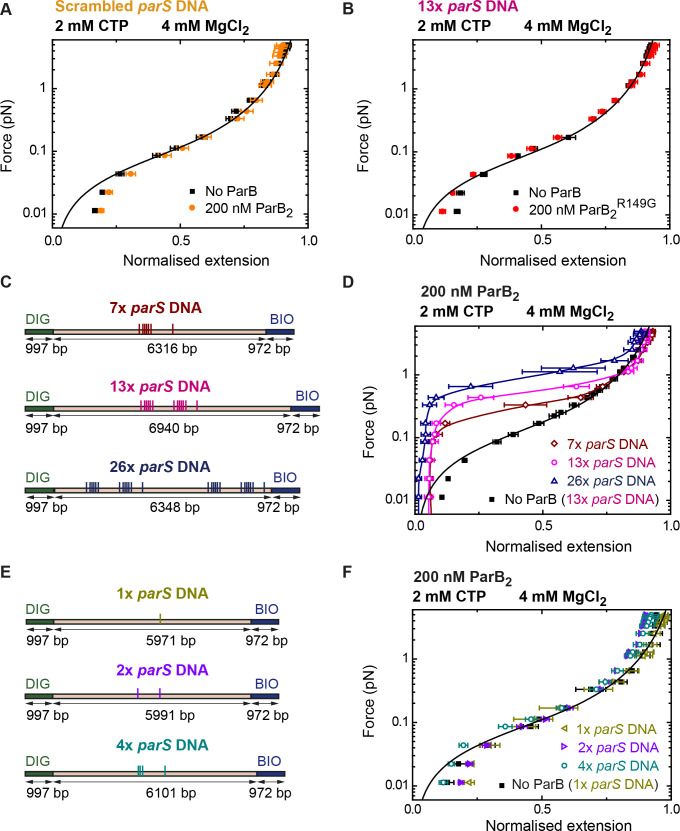
Figure 6—source data 1. Source data file for Figure 6.

Figure 6.

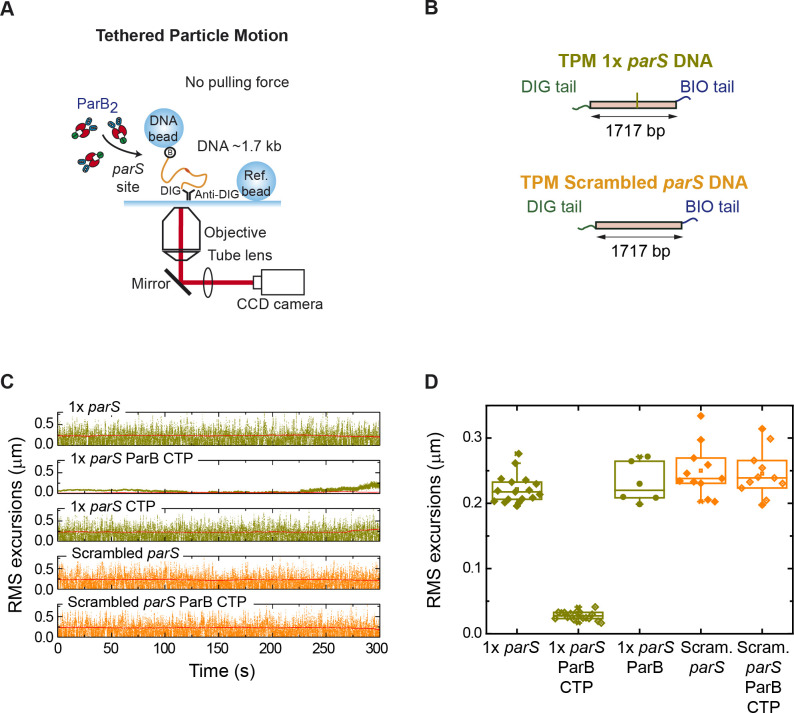
Figure 6—figure supplement 1. Tethered particle motion (TPM) experiments show single-parS DNA condensation by ParB.

Figure 6—figure supplement 1.

(A) Cartoon of the TPM setup. Essentially, the same employed for magnetic tweezers (MT) experiments but without the magnets. (B) Schematic representation of the TPM 1× parS DNA and TPM scrambled parS DNA substrates used for TPM experiments. (C) Examples of time courses of root mean squared (RMS) and RMSτ excursions (see Materials and methods) of one tether under the indicated experimental conditions. (D) Box plot of mean RMSτ excursions of multiple tethers for different experimental conditions. ParB is able to condense single-parS DNA in the presence of CTP-Mg2+.
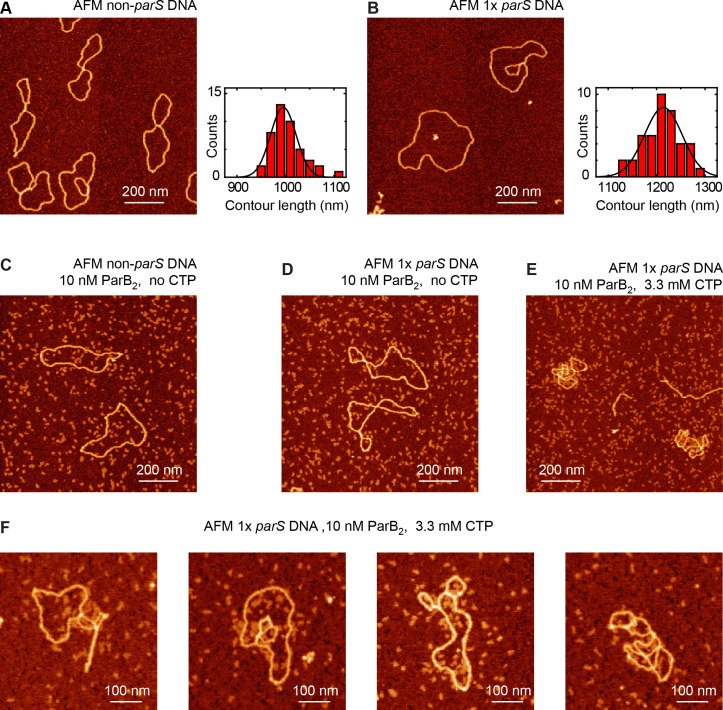
Figure 6—figure supplement 2. Atomic force microscopy (AFM) experiments show single-parS DNA condensation by ParB.

Figure 6—figure supplement 2.

(A) AFM image of control non-parS DNA (left) and histogram of contour lengths (right, n = 44). (B) AFM image of AFM 1× parS DNA (left) and histogram of contour lengths (right, n = 41). (C) Characteristic AFM image of experiment including non-parS DNA and 10 nM ParB2 in the absence of cytidine triphosphate (CTP). No interaction between protein and DNA was observed. (D) Representative AFM image of experiment including 1× parS DNA and 10 nM ParB2 in the absence of CTP. No interaction between protein and DNA was observed. (E) Characteristic AFM image of experiment including 1× parS DNA, 10 nm ParB2, and 3.3 mM CTP. 1× parS plasmids appeared partially compacted due to the interaction with ParB. (F) Examples of individual 1× parS DNA molecules interacting with ParB under CTP conditions.