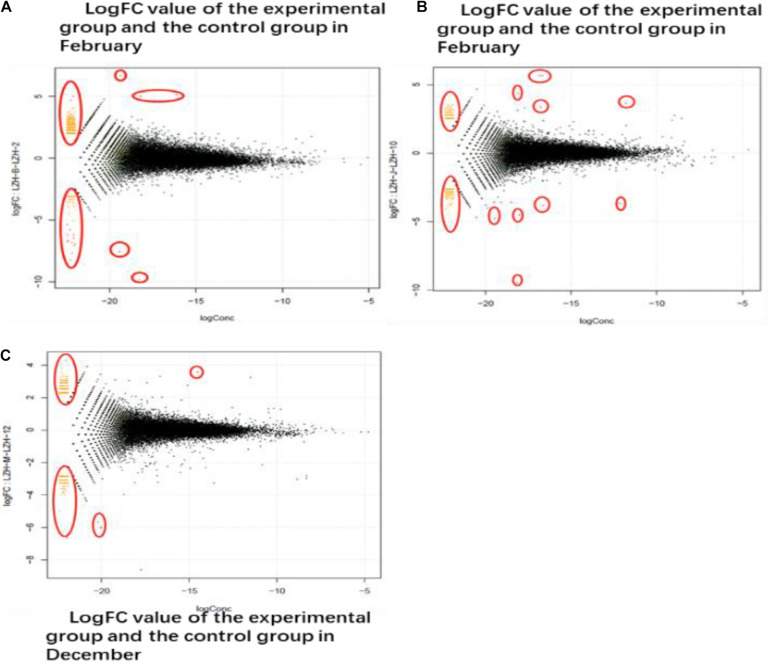
FIGURE 4.
DEG different period of cashmere. (A) LogFC value of the experimental group and the control group in February. The transcriptome data of the experimental group and the control group in February, October, and December were screened for differentially expressed genes. The co-expressed genes were on the outside and the different genes were on the inside. (B) October LogFC value of the experimental group and the control group. In October, 641 genes were screened out, of which 178 were down-regulated and 463 were up-regulated. (C) The LogFC value of the experimental group and the control group in December. In December, 305 differentially expressed genes were screened, among which 138 up-regulated genes had 167 differences.

