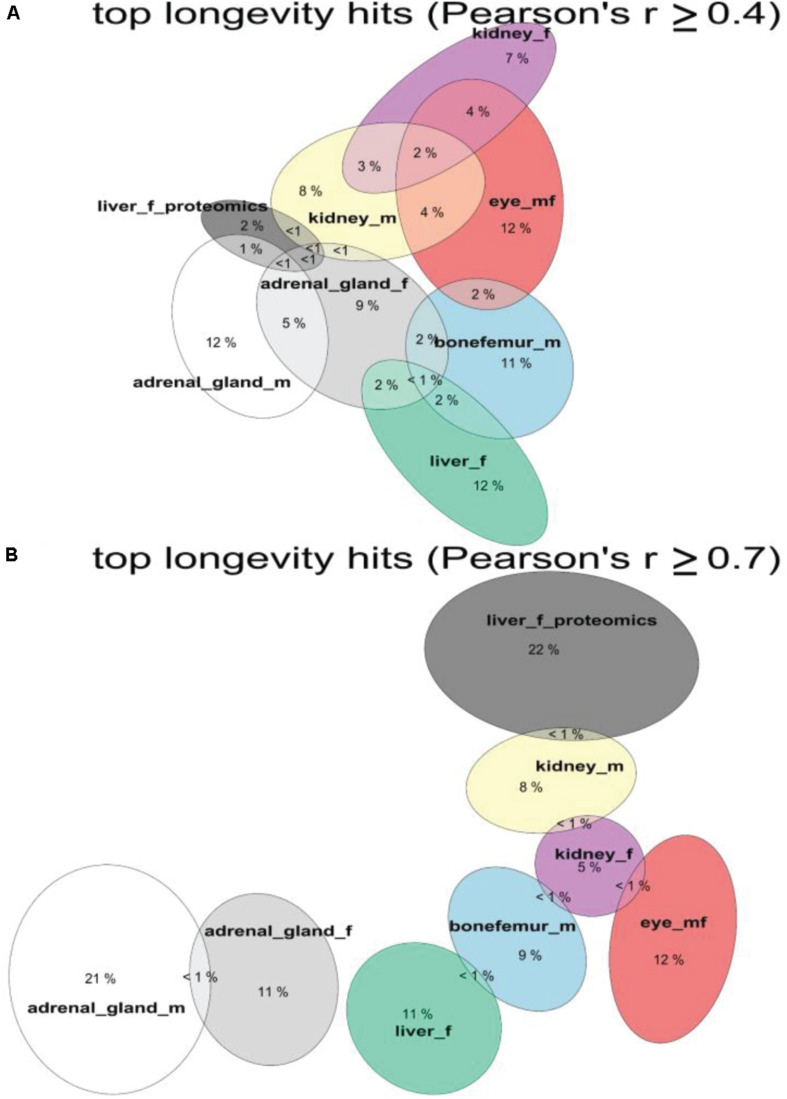
FIGURE 4.
Shared longevity-correlated genes from different tissues. The overlap in percentages of longevity-correlating genes and proteins among tissues and datasets. Overlap with threshold of Person’s | r| ≥ ± 0.4 for (A) and | r| ≥ ± 0.7 for (B). See Supplementary Table 4.

