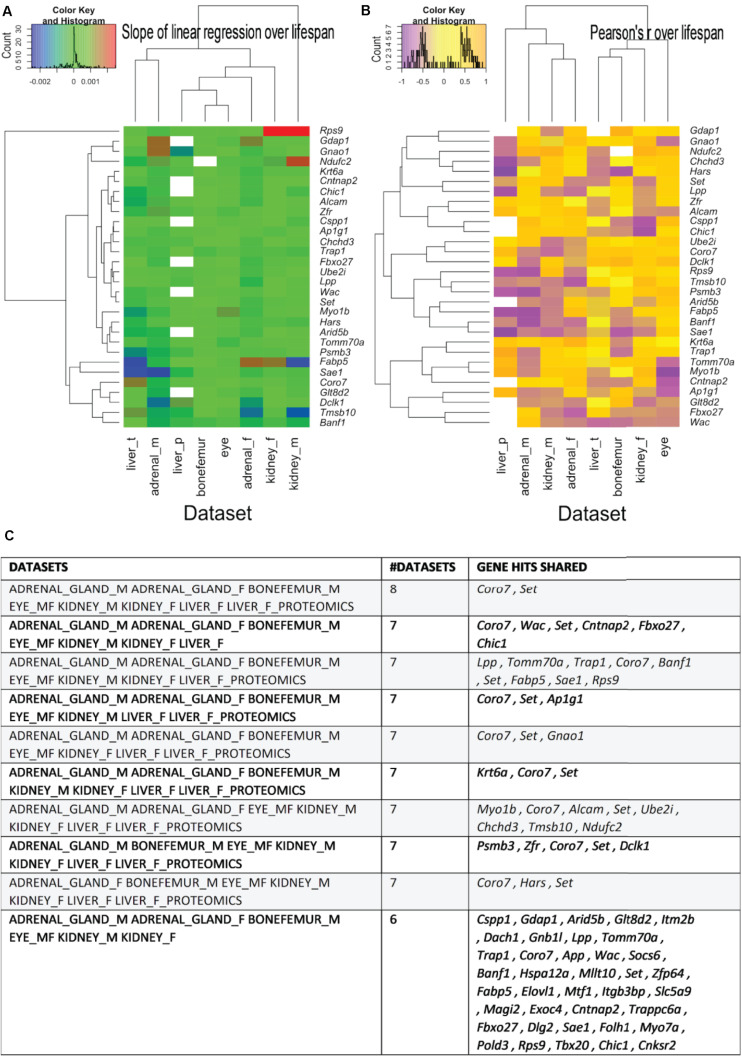
FIGURE 5.
The most shared genes correlating with lifespan. (A) Heatmaps showing the clustered common longevity genes by both the values of the linear regression over median strain lifespans, respectively. (A) Pearson’s correlation coefficient over the median strain lifespans (B) and tissue of origin (A,B). The commonality is here intended as being present in the source -omics data with a Pearson’s r absolute value greater than 0.4 and in more than one data set. Particularly, the genes used for generating the heatmaps are the ones that are present in most tissues and are shown in panel C, with the indication (left column) of the dataset they come from. See Supplementary Table 6 for a more detailed listing of the genes.

