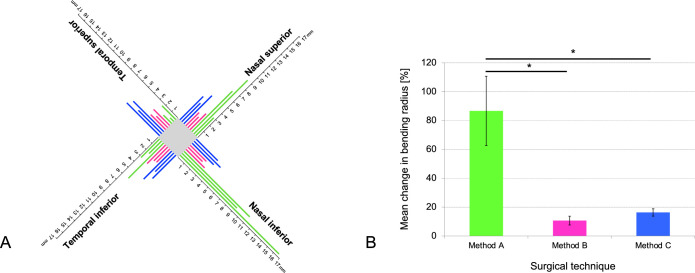
Figure 8.
Individual bending radius in four viewing directions. (A) Chart illustrates the individual bending radius in mm for nine subjects in the four viewing directions: temporal superior, temporal inferior, nasal superior, and nasal inferior. Green lines indicate patients with method A operation (straight route), pink lines indicate patients with method B operation (parabulbar loop), and blue lines indicate patients with method C operation (encircling band). While bending radius for methods B and C was similar in the four viewing directions, patients with method A showed an increased bending radius in the nasal directions. With a straight route (method A) bending radius varied strongly between the viewing directions. (B) Bar chart displaying the mean variation ± standard deviation of the mean in bending radius (%) for the three surgical techniques: Method A (straight route), method B (parabulbar loop), and method C (encircling band). Each method was evaluated in three subjects and four viewing directions (temporal superior, temporal inferior, nasal superior, and nasal inferior). Asterisks indicate significant differences (P < 0.017).

