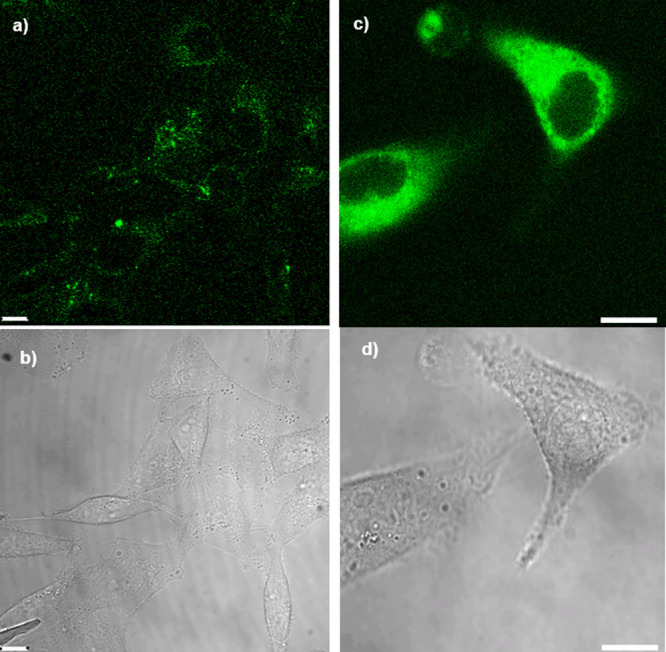
Figure 11.

(a) Confocal fluorescence imaging in living CA IX positive HCT116 cells of the free base precursor 3.16 10 μM 16 h (λex = 410 nm, λem = 625 nm), and (b) corresponding bright field image. (c) Confocal fluorescence imaging in living CA IX positive HCT116 cells of the gallium complex 3.19 16 h, λex = 405 nm, λem = 625 nm and (d) corresponding bright field image; Scale bar = 10 μm.
