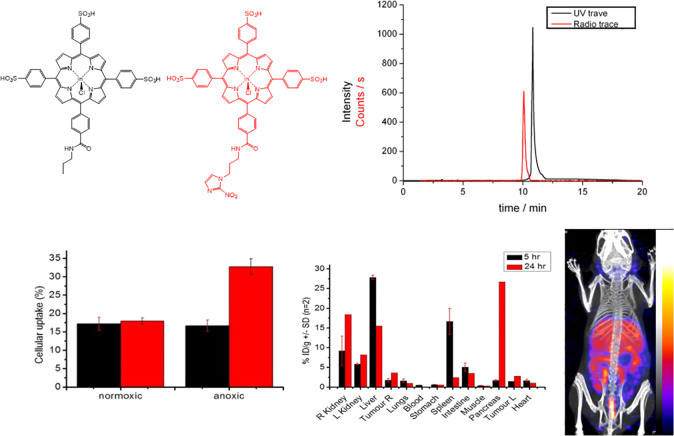
Figure 13.
(top) Structures of [111In]3.24 (red) and [111In]3.15 (black) with corresponding UV–vis and radio HPLC traces. (bottom) Hypoxia selectivity assay in vitro (HeLa cell line), biodistribution data of [111In]3.15, and SPECT image measured at 24 h of MKN45 tumor bearing mice injected with 3.15 (n = 6). Further details are given in SI.

