
Figure 1: Metabolism focused CRISPR-Cas9 screens identify metabolic modifiers of lipid peroxidation upon cystine deprivation and GPX4 inhibition.
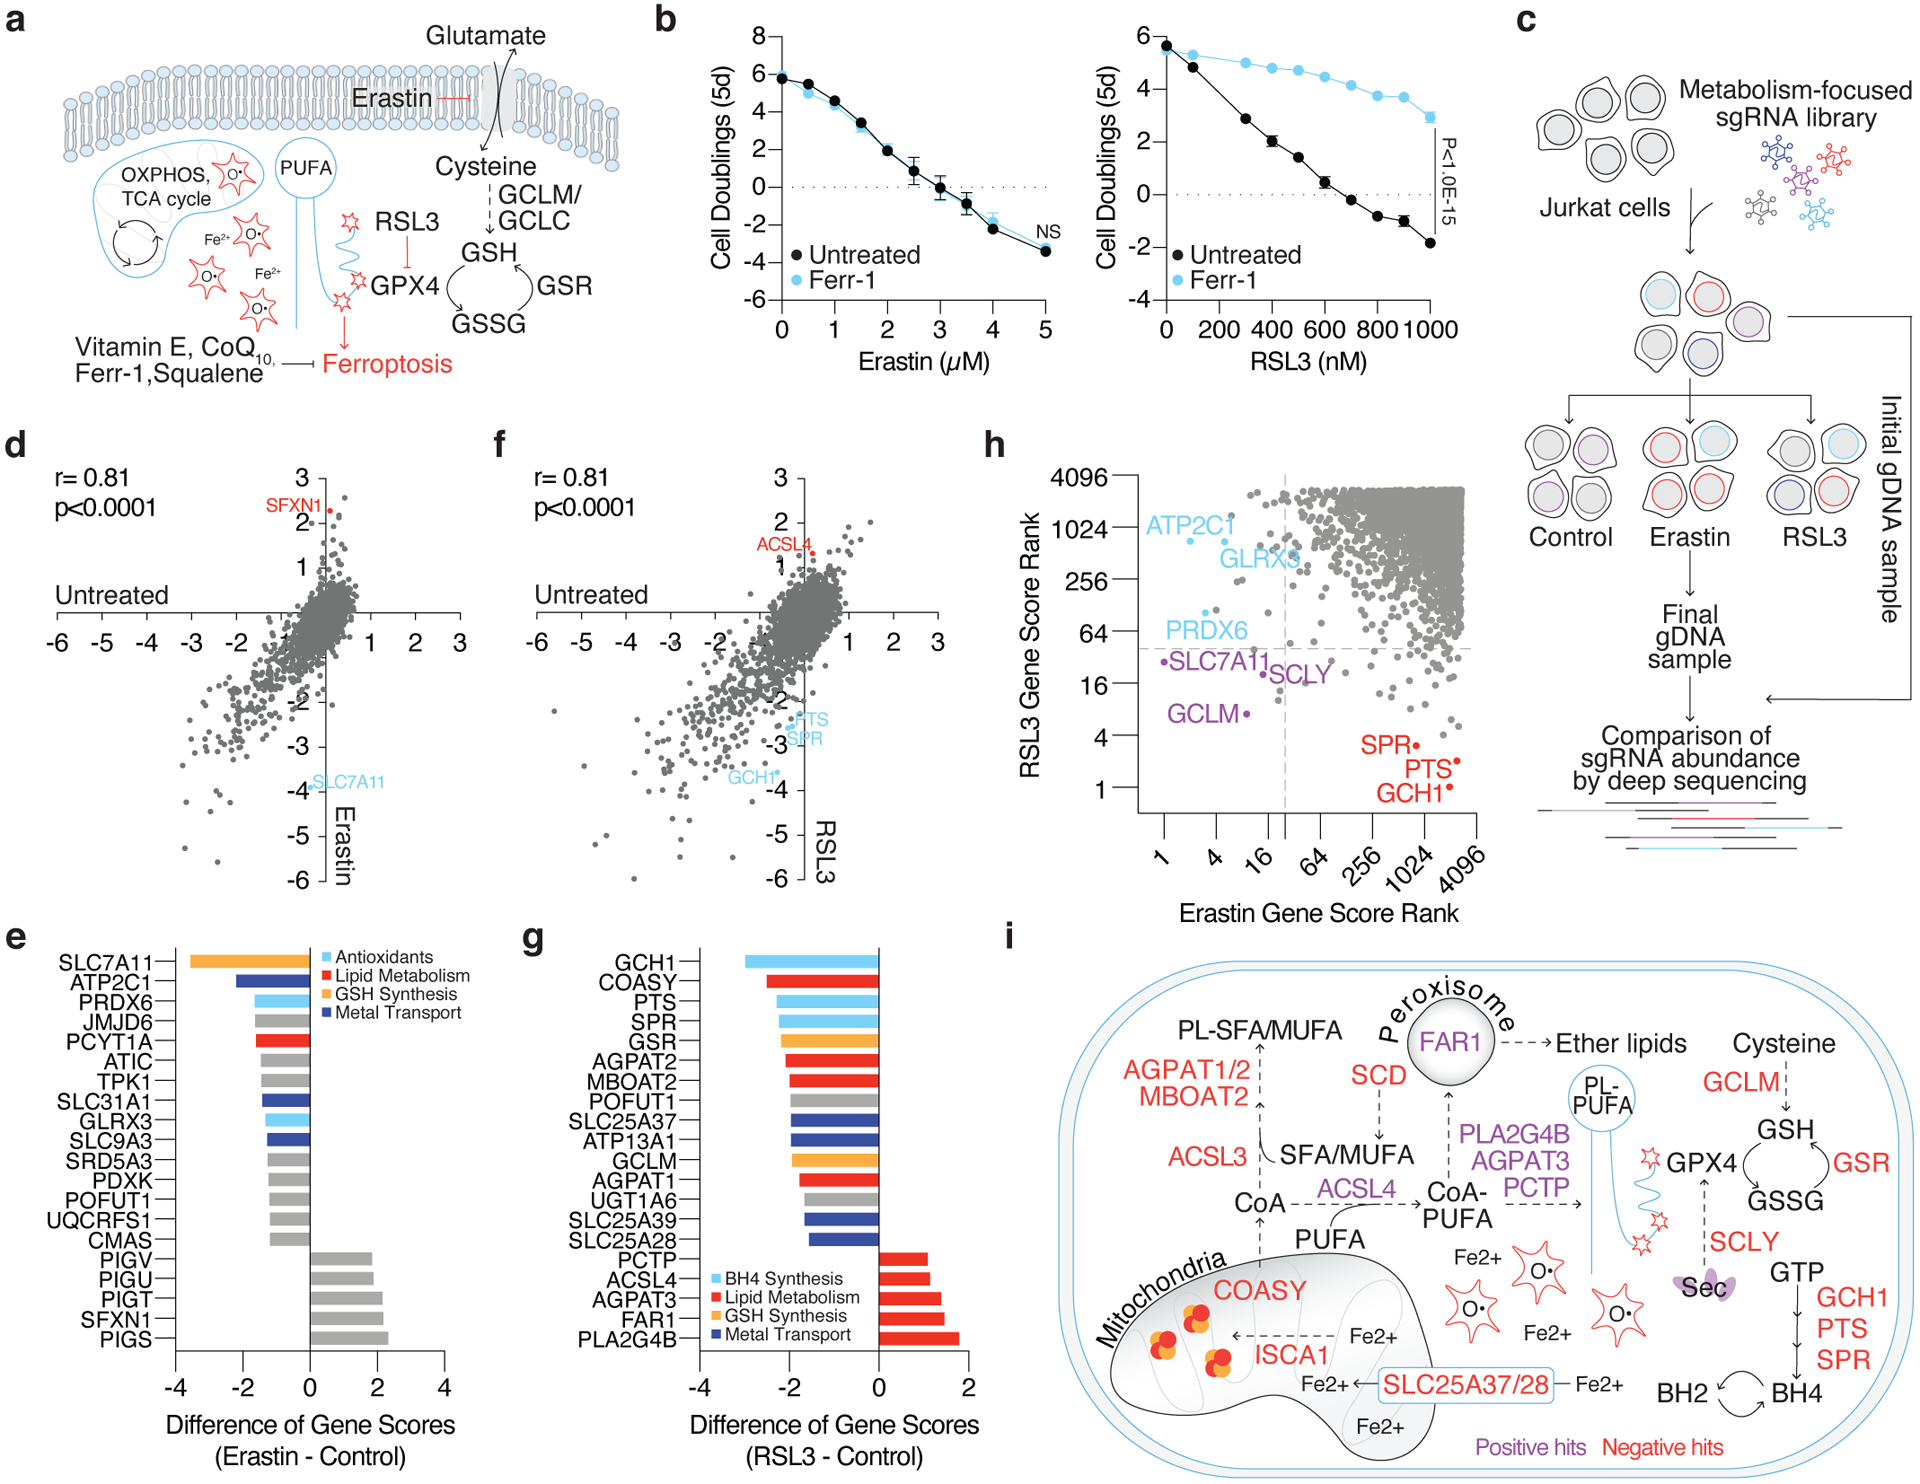
(A) Iron reacts with hydrogen peroxide via the Fenton reaction to produce hydroxyl radicals that damage poly-unsaturated fatty acids (PUFAs). To mitigate lipid peroxidation, cells utilize GPX4, which reduces lipid peroxides at the expense of glutathione (GSH). Alternatively, endogenous antioxidants can quench ROS and lipid peroxides. The accumulation of lipid peroxides either by inhibition of cystine uptake (erastin) or GPX4 (RSL3) induces ferroptosis.
(B) Fold change in cell number (log2) of wild type Jurkat cells treated with erastin (left, black) or RSL3 (right, black) and co-treated with ferrostatin-1 (Ferr-1, blue, 1μM). Data shown as mean ± SD, n=3 biological replicates.
(C) Jurkat cells were transduced with a metabolism-focused library of sgRNAs targeting ~3,000 genes. Transduced cells were cultured without treatment, with erastin (0.5μM), or with RSL3 (0.5μM) for ~14 population doublings. Cells were collected and their genomic DNA (gDNA) isolated. sgRNA abundance was determined by deep sequencing and final sgRNA counts were compared to initial counts to calculate the median differential score for each gene.
(D) Gene scores of untreated (x-axis) and erastin treated (y-axis) Jurkat cells.
(E) Top-scoring genes under erastin treatment. Negative scores represent genes whose loss potentiates erastin toxicity while positive scores represent genes whose loss provides resistance to erastin.
(F) Gene scores of untreated (x-axis) and RSL3 treated (y-axis) Jurkat cells.
(G) Top-scoring genes under RSL3 treatment. Negative scores represent genes whose loss potentiates RSL3 toxicity while positive scores represent genes whose loss provides resistance to RSL3.
(H) Comparison of gene score ranks from erastin and RSL3 screens. Unique hits (p<0.01) in the erastin screen are highlighted (blue) in quadrant II, shared hits are highlighted (purple) in quadrant III, and unique hits in the RSL3 screen are highlighted (red) in quadrant IV.
(I) Summary of positive and negative hits of the RSL3 screen. Red signifies genes essential for survival under GPX4 inhibition (negative hits) and purple signifies genes whose loss provided a proliferative advantage (positive hits).