
Extended Data Figure 2: CRISPR-Cas9 genetic screens identify metabolic regulators of the cellular response to cystine depletion and GPX4 inhibition.
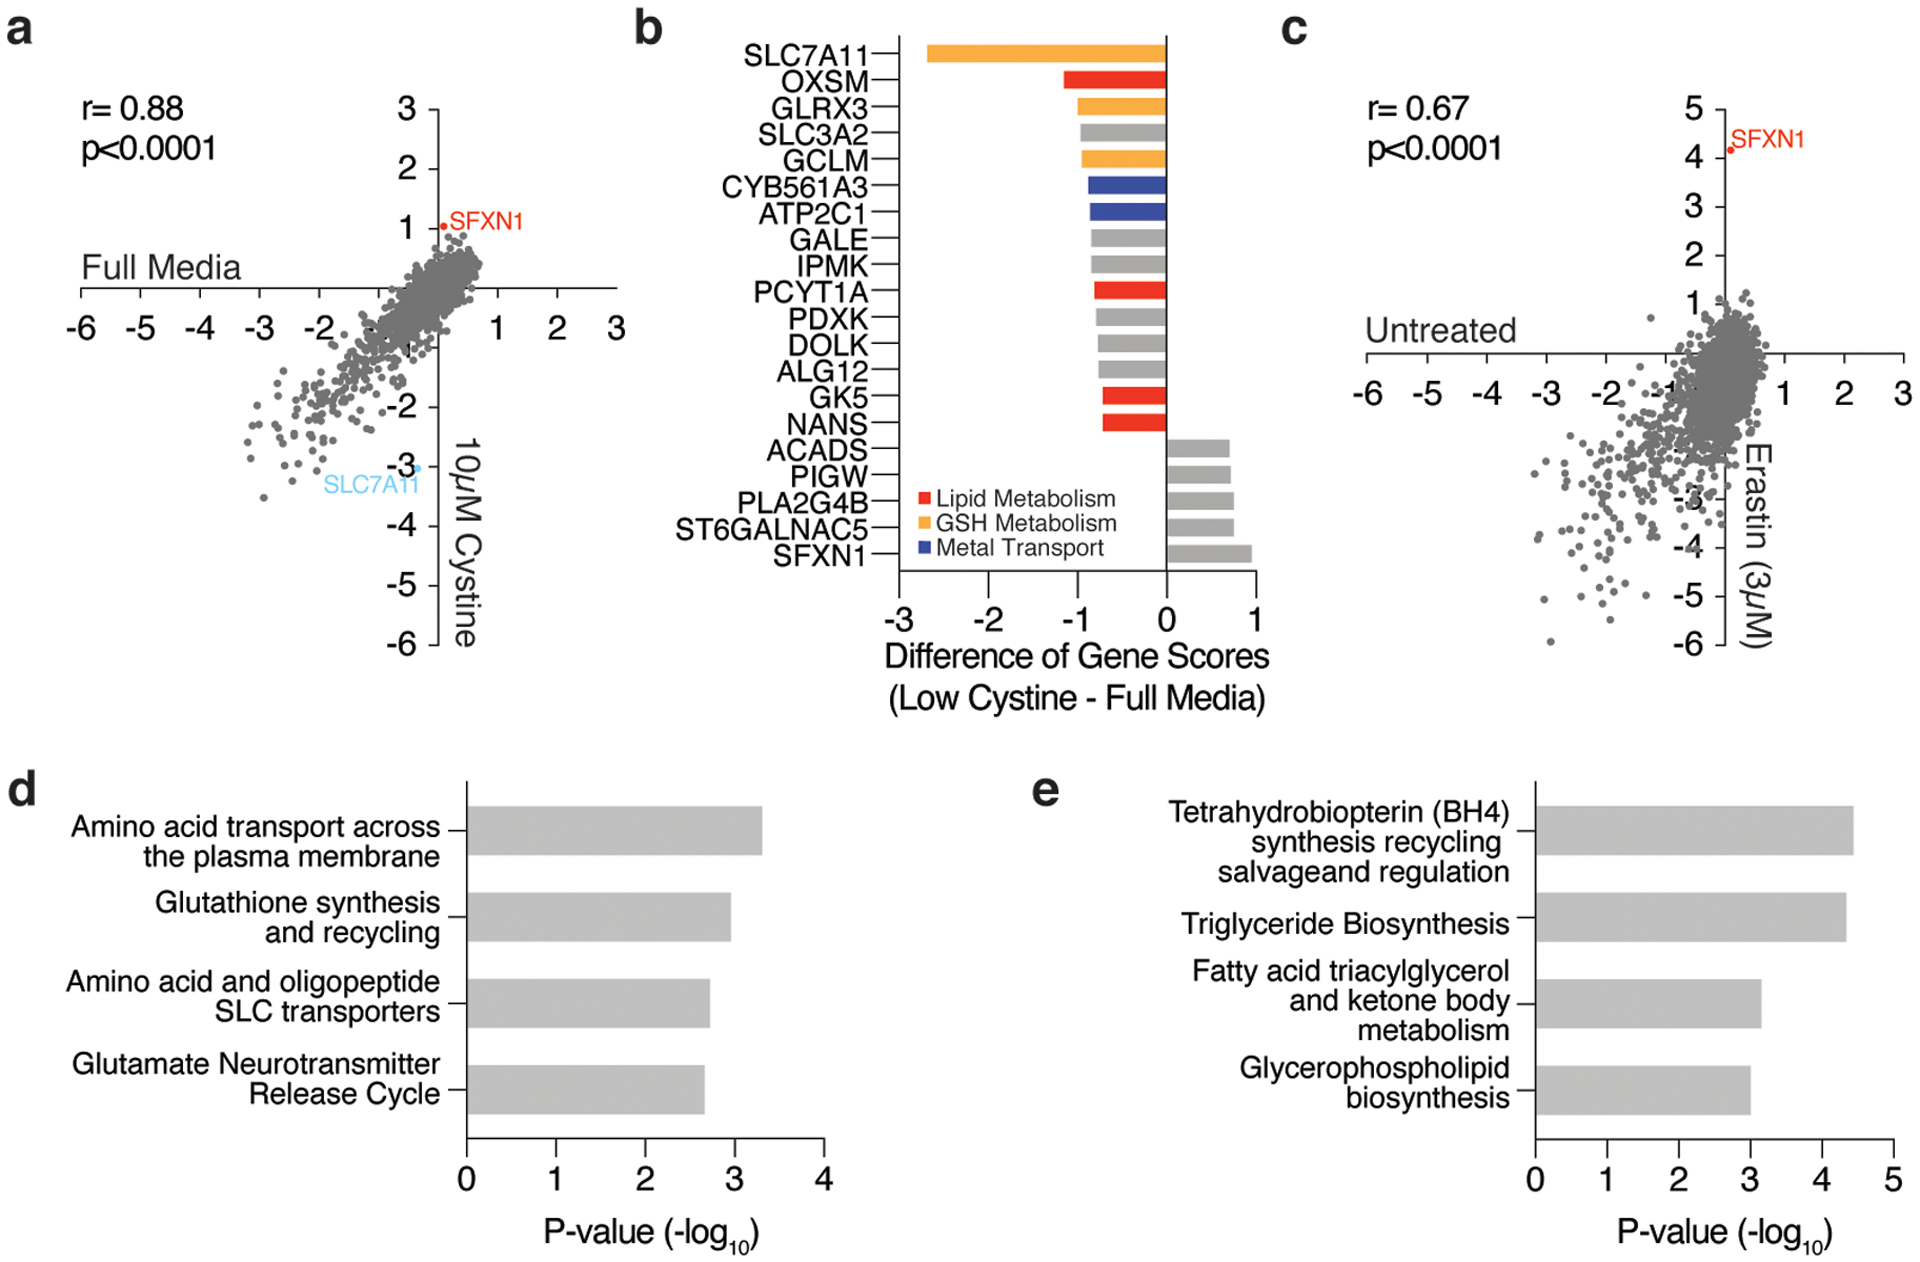
(A) Gene scores of Jurkat cells left untreated (x-axis) or cultured in low cystine (10μM, y-axis).
(B) Top-scoring genes under low cystine conditions. Negative scores represent genes whose loss potentiates low cystine toxicity while positive scores represent genes whose loss provides resistance to low cystine.
(C) Gene scores of untreated (x-axis) and erastin treated (3μM, y-axis) Jurkat cells.
(D) Significantly enriched pathways (REACTOME) represented within the top 50 most essential genes in the low dose erastin screen.
(E) Significantly enriched pathways (REACTOME) represented within the top 50 most essential genes in the RSL3 screen.