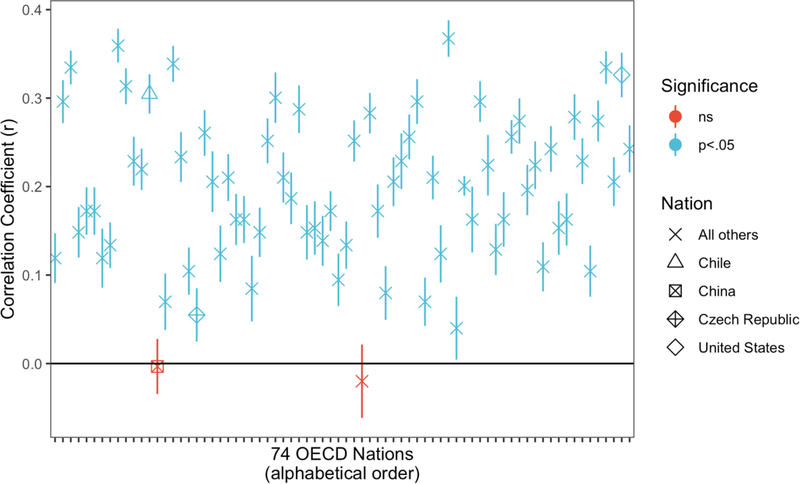
Figure 1. Correlations between mindset and test scores in 74 nations administering the mindset survey in the 2018 PISA (N = 555,458).
Note: Each dot is a raw correlation between the single-item mindset measure and PISA reading scores for each nation’s 15 year-olds. Bars: 95% CIs. Data Source: OECD, PISA 2018 Database, Table III.B1.14.5. Data were reported by the OECD in SD units; these were transformed to r using the standard “r from d” formulas. One nation contributed three different effect sizes according to the OECD (China: for Macao, for Hong Kong, and for four areas of the mainland); these three effect sizes were averaged here. Looking at the three China effects separately, each was near zero, and mainland China was negative and significant.

