
Extended Data Fig. 1 |. Structure determination of the NLRP1-DPP9 complex.
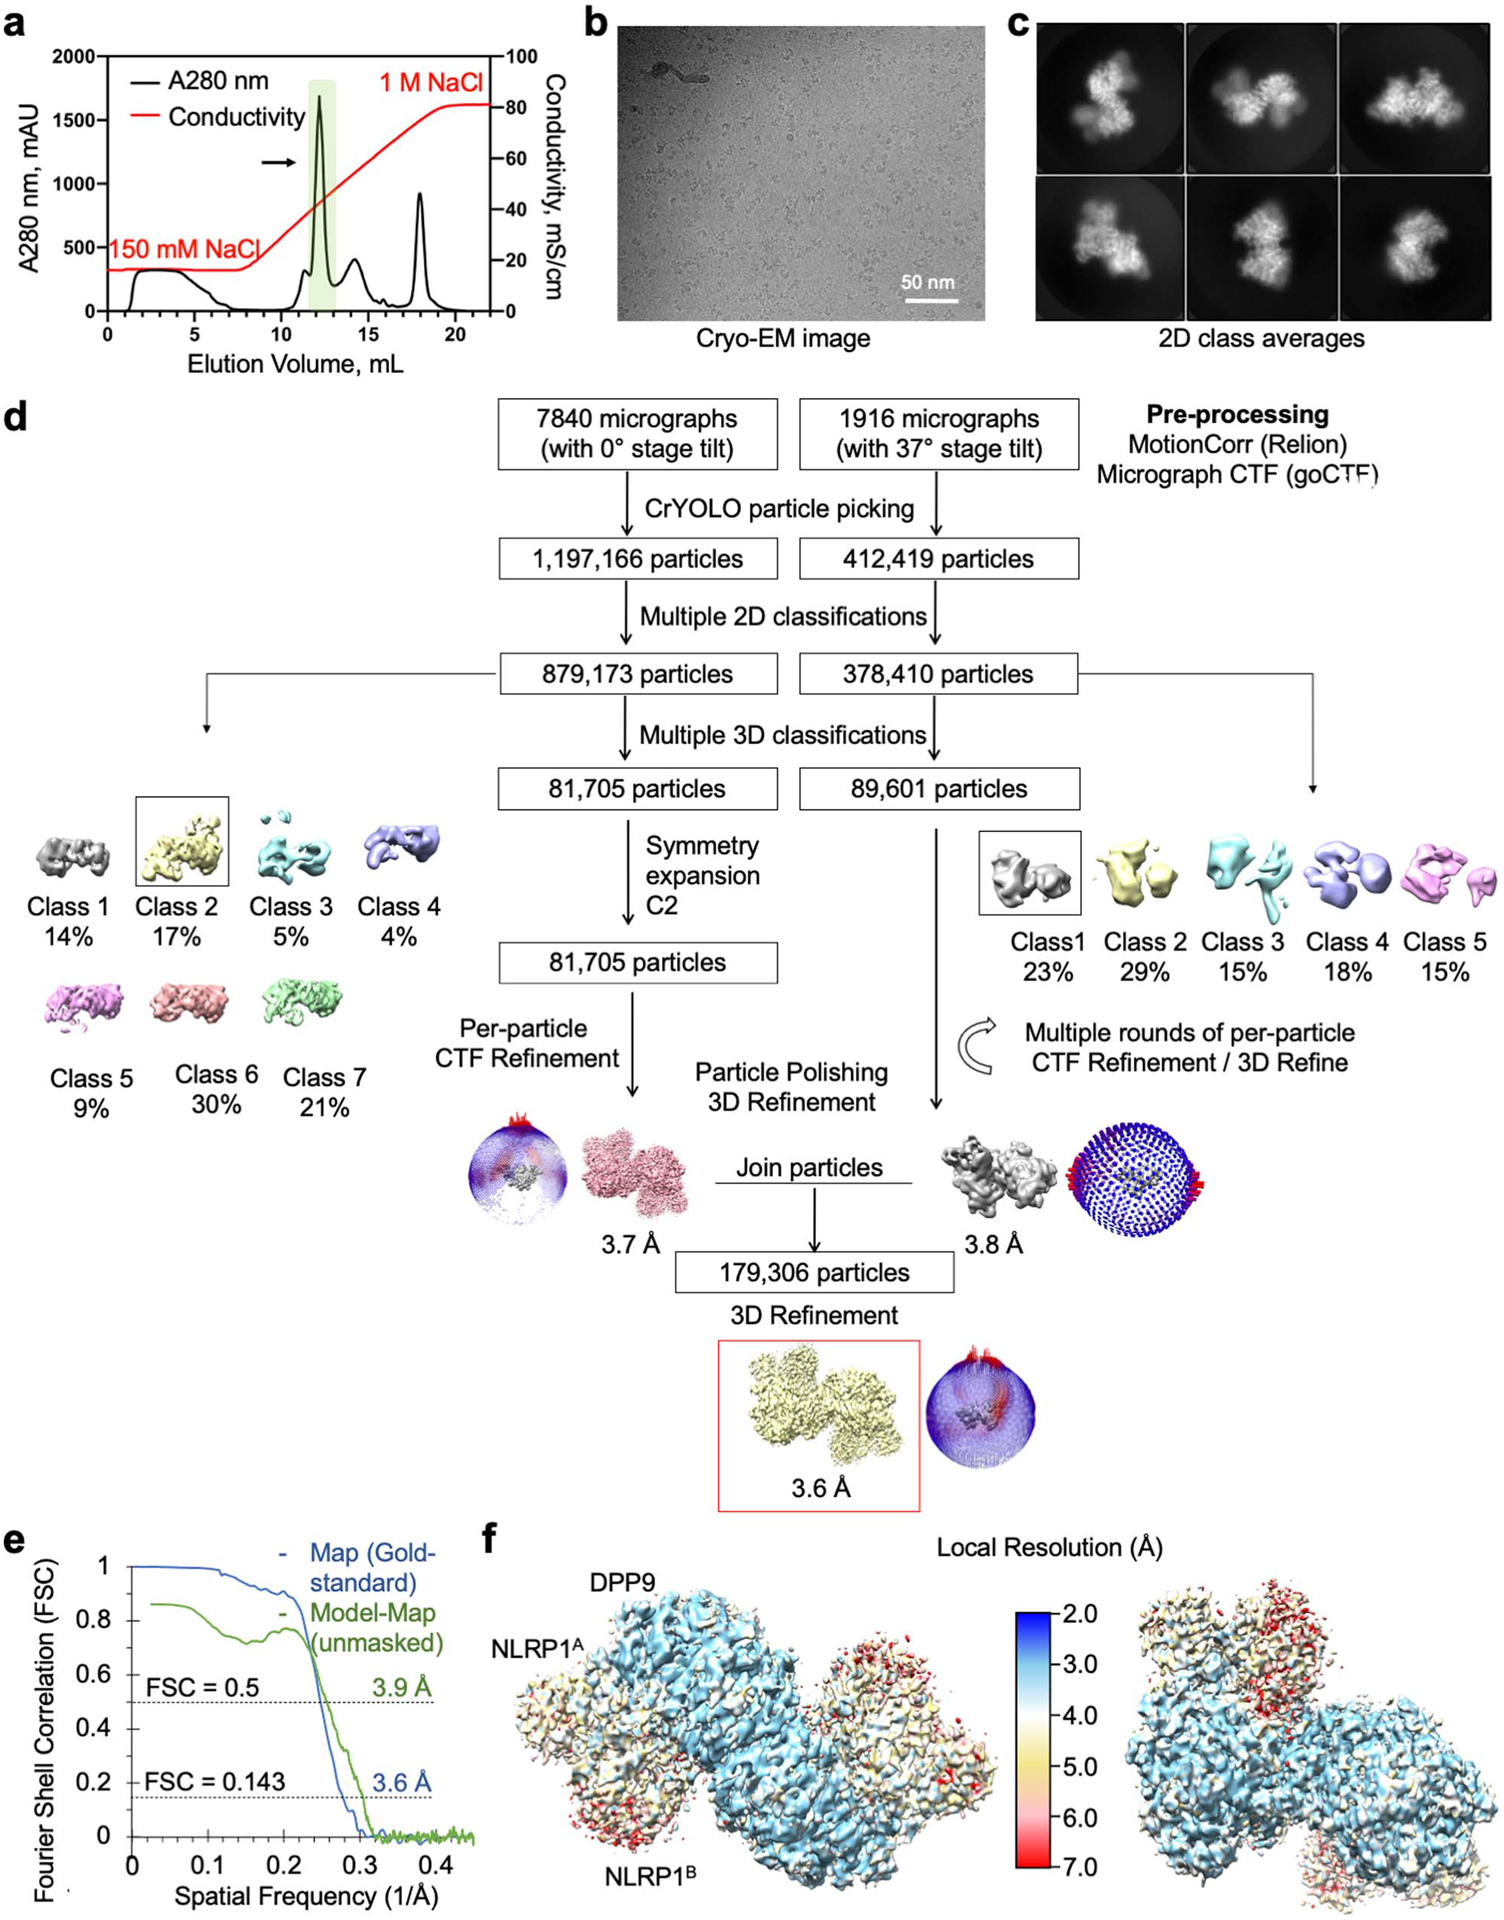
a, Purification of the NLRP1-DPP9 complex by ion exchange chromatography. The ternary complex peak is shaded in green and labelled with an arrow. b, A representative (>1000 images) cryo-EM micrograph. c, Representative 2D class averages. d, Workflow for the NLRP1-DPP9 complex structure determination. e, Map-map and map-model FSC curves. f, Local resolution distribution of the final map calculated with ResMap45 and coloured as indicated.