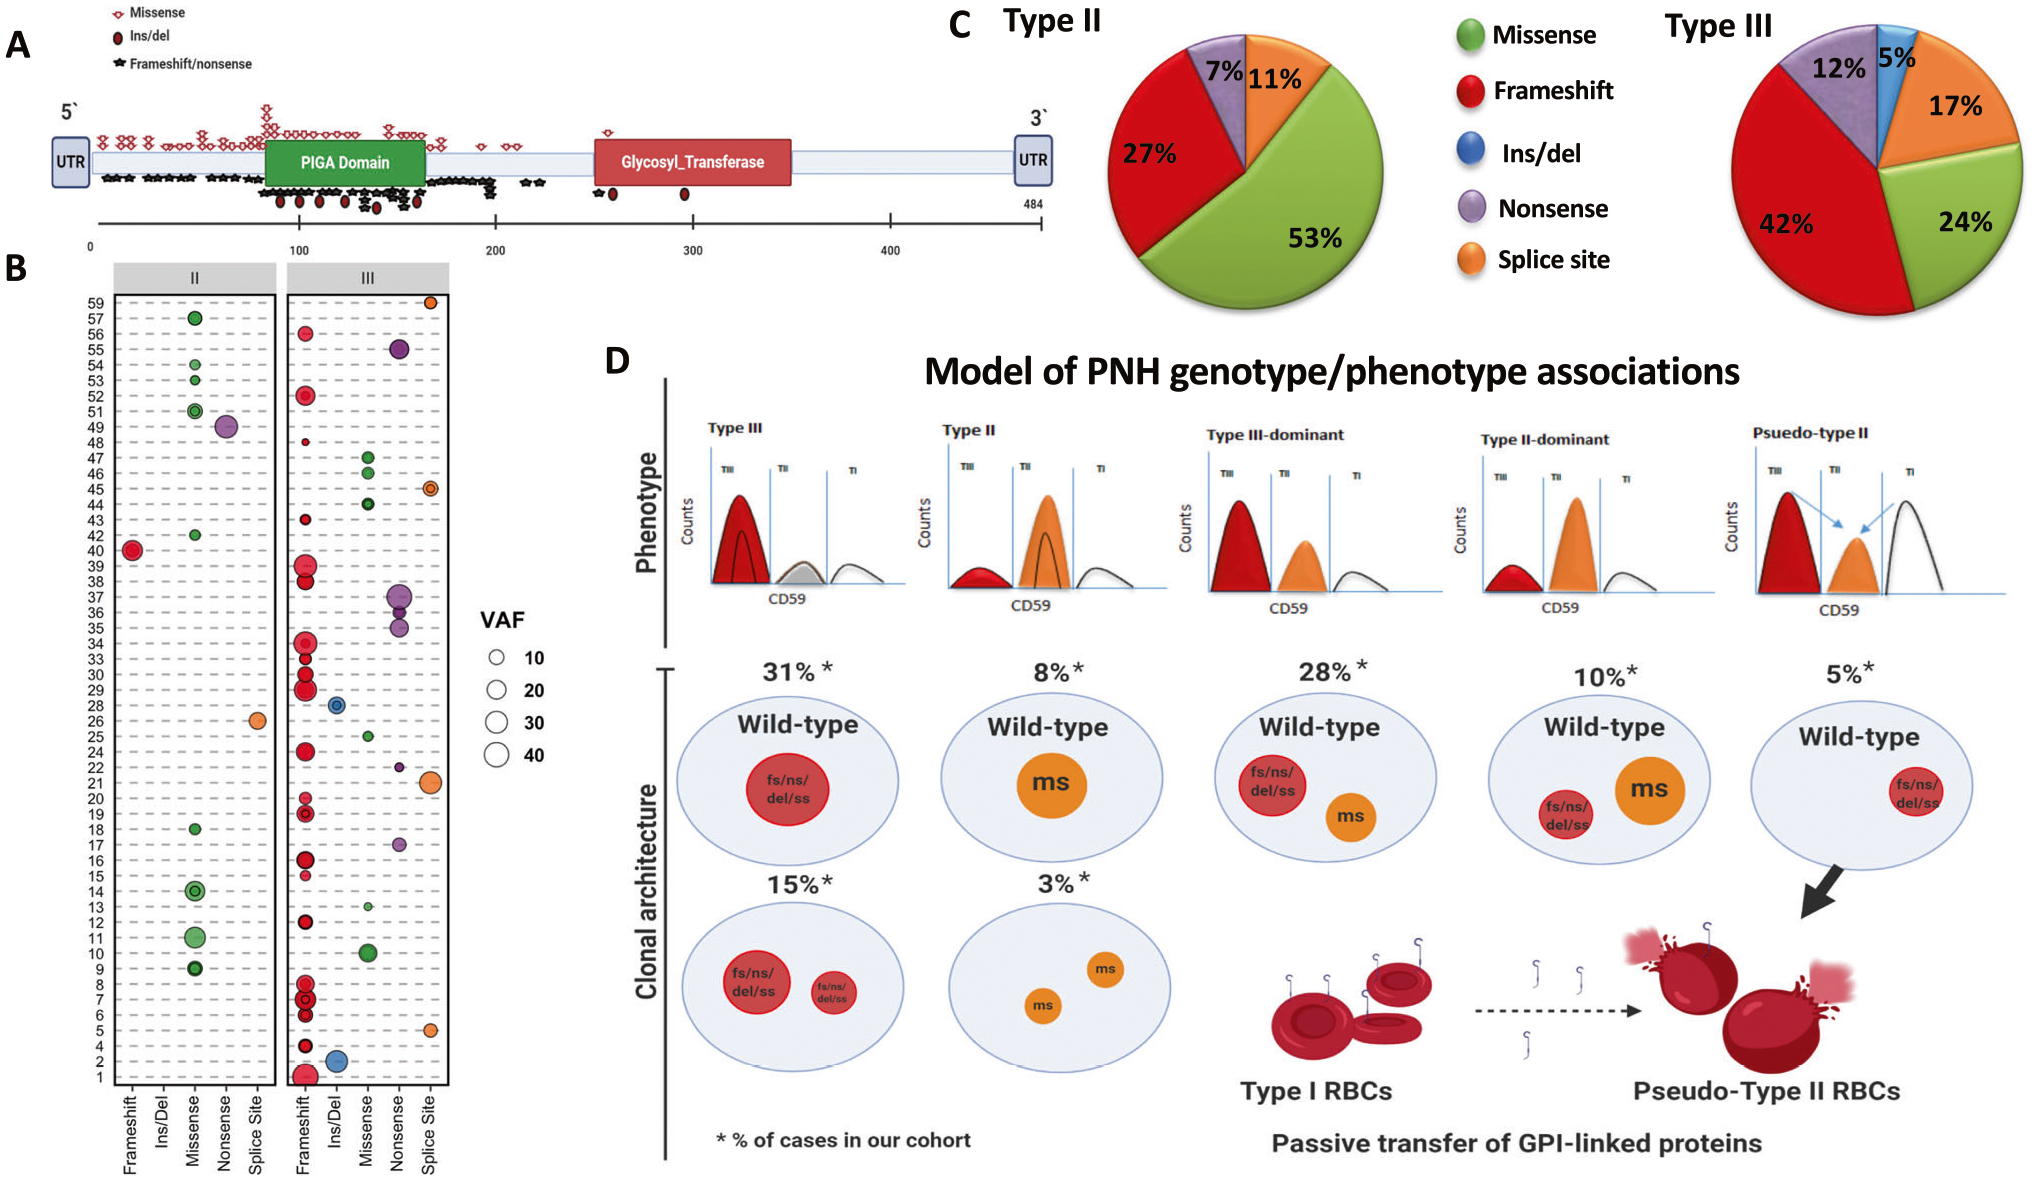
Fig. 1. PIGA mutational landscape of hemolytic PNH.

A Lollipop plot for amino acid changes resulting from PIGA mutations. B Bubble chart outlining PNH patients and their mutations according to the type and the size (VAF) of PIGA somatic hits (the area of the bubble is proportional to PIGA VAF). C Pie charts showing the differences in mutation types between patients with type II and type III RBCs. D Model depicting the various possibilities of PIGA mutations and the resultant phenotypes: TII RBCs phenotype in the presence of a dominant missense mutation (8% of cases in our cohort) or multiple missense mutations (3%); TIII RBCs phenotype in the presence of a truncating mutation (31%) or in the presence of multiple truncating mutations (15%); T-III dominant in case of a dominant truncating and a subclonal missense mutation (28%); TII-dominant in case of a dominant missense and a subclonal truncating mutation(10%); pseudo-TII RBCs phenotype in case of patients with TII RBCs phenotype harboring truncating mutations (5%). Pseudo-TII RBC may result from the passive transfer of GPI-linked proteins from normal RBCs (type I) to the GPI-deficient TIII RBCs generated by non-missense mutations in TII dominant patients (pseudo-TII), a phenomenon called “painting” process.Fs frameshift, del/ins deletion/insertion, ss splice site, ns nonsense, ms missense, VAF variant allelic frequency calculated as the sum of all mutations found in an individual patient (*adjusted for X-chromosome zigosity).
