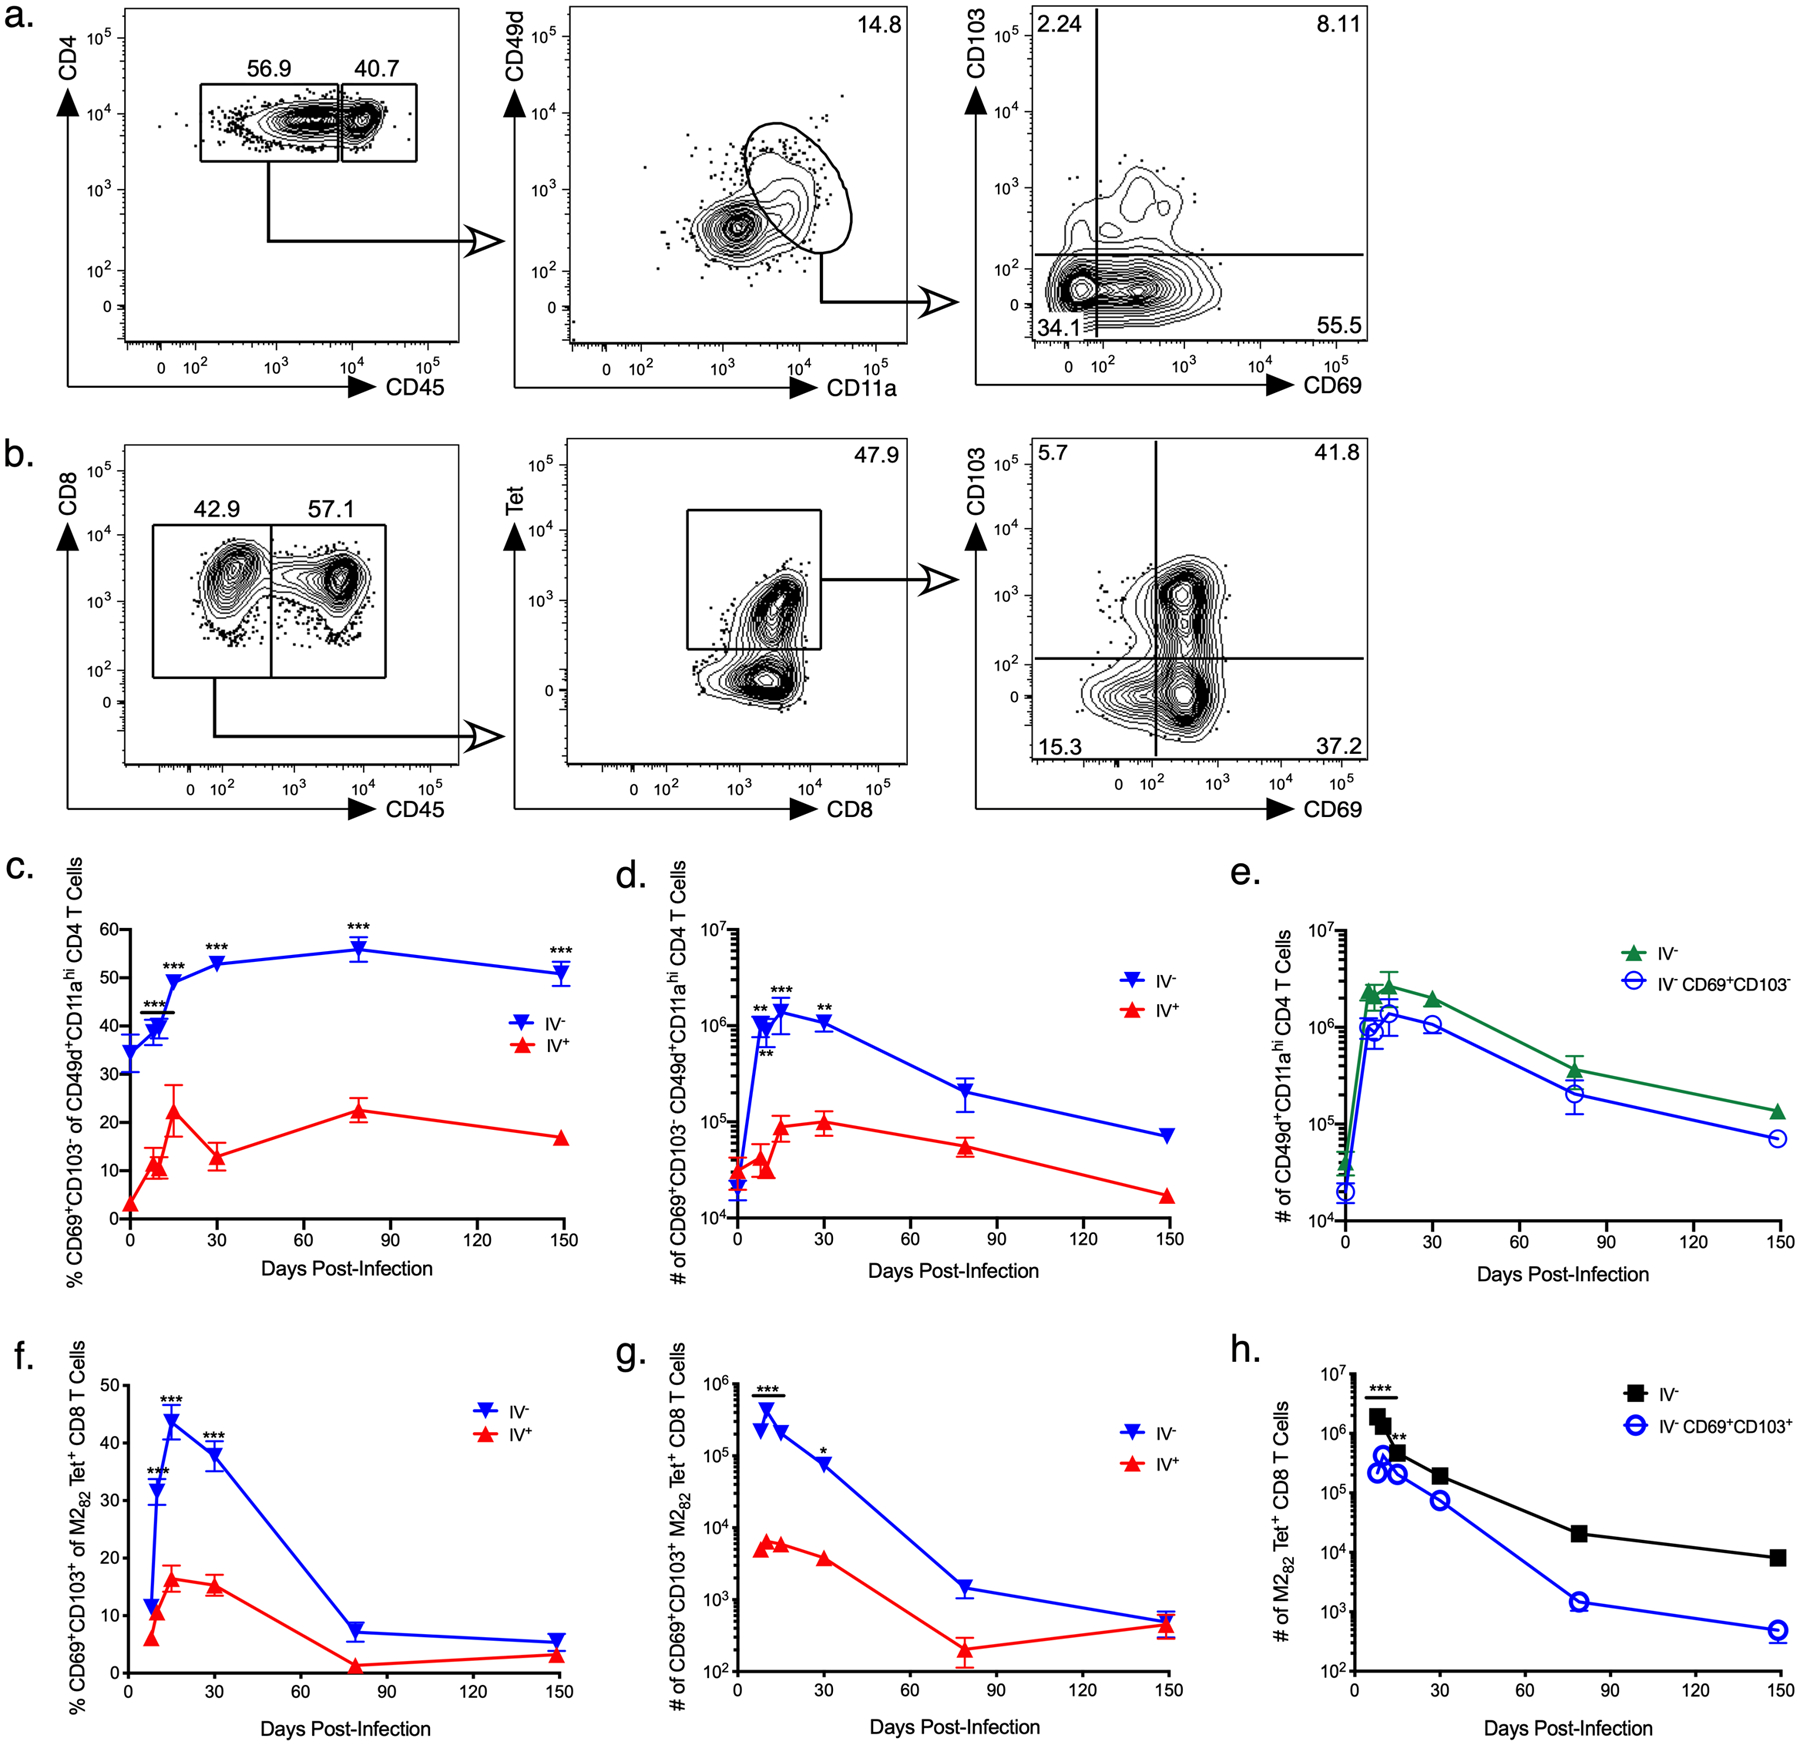
Figure 2. CD4 and CD8 T cells numbers wane with time after RSV infection.

BALB/c mice were infected with RSV i.n., and lungs were harvested at days 8, 10, 15, 30, 79, and 149 p.i. Cells were analyzed by flow cytometry and gated on RSV-specific a) TRM CD4 T cells and b) TRM CD8 T cells in the lung parenchyma as shown. Representative staining panels are from day 30 p.i. c) Frequency and d) number of CD69+CD103− CD49d+CD11ahi CD4 T cells in the pulmonary parenchyma (IV−) and vasculature (IV+). e) Number of IV− CD69+CD103− CD49d+CD11ahi TRM and total CD49d+CD11ahi CD4 T cells in the lung. f) Frequency and g) number of IV− and IV+ CD69+CD103+ M282 tetramer+ CD8 T cells in the lung. h) Number of CD69+CD103+ M282 tetramer+ TRM and total M282 tetramer+ CD8 T cells in the lung. Data are presented as mean ± SEM from two independent experiments that have been combined (n=3–4 mice per experiment). Statistical analysis was performed with Student’s t test, * p<0.05, ** p <0.01, *** p<0.001.
