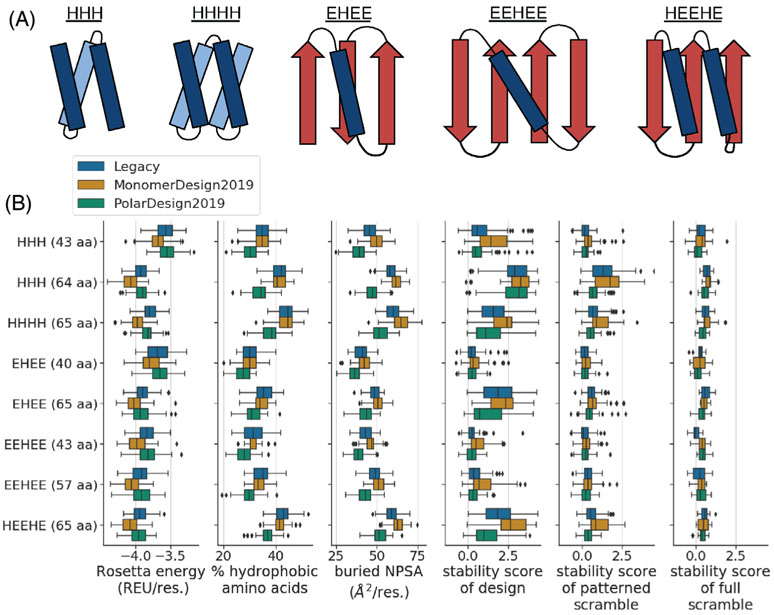
FIGURE 5.
Comparison of de novo mini-protein designs made using different FastDesign protocols. A, We designed eight structurally unique groups of proteins, where each group had a unique length and topology (see the y axis of the plots in panel B). These groups span five different topologies. This panel shows example diagrams of each topology, with helices in blue, strands in red, and titles indicating the order of helices (H) and strands (E) in primary sequence. B, The box plots compare designs as a function of structural group (y axis) and FastDesign protocol (hue of box). The x axis of each plot quantifies a different property of the designs. The first three box plots quantify computed biophysical properties including: the Rosetta energy of a design (normalized by protein length; REU: Rosetta Energy Units), the percent of amino acids in a design that are hydrophobic, and the amount of buried non-polar surface area (NPSA) in a design (normalized by protein length). The last three box plots show stability scores from the high throughput experiment, with the first plot showing data for designs and the other two showing data for scrambled controls. In all box plots, the box shows the quartiles of the distribution, the whiskers show the range of points that are within 1.5 times the interquartile range beyond the highest and lowest quartiles, and diamonds show outlier points outside of this range. We only show data for designs and controls with high-quality data from the high-throughput stability assay (Figures S2A and S7)

