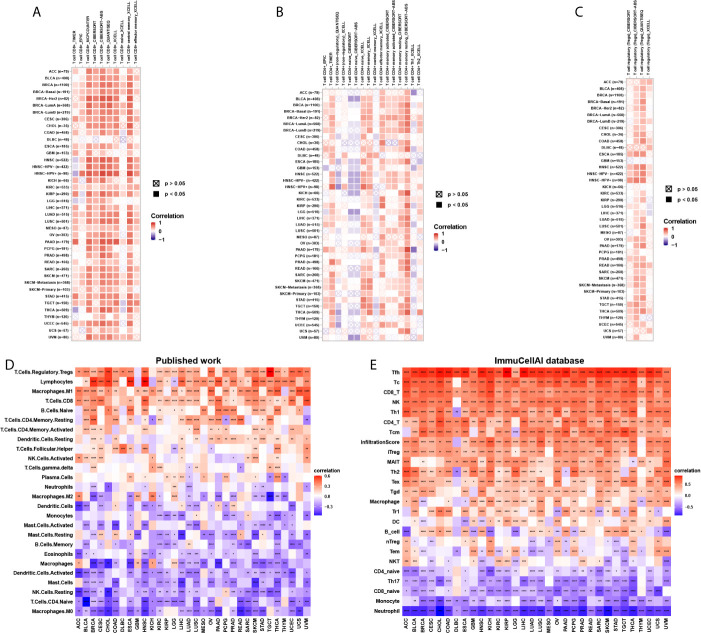
Figure 7.
Immune cell infiltration analysis. (A), The correlation between CD161 and infiltration level of CD8+ T cells using TIMER2 database. (B), The correlation between CD161 and infiltration level of CD4+ T cells using TIMER2 database. (C), The correlation between CD161 and infiltration level of Tregs using TIMER2 database. (D) The correlation between CD161 and infiltration level of indicated immune cells using data from published work. (E) The correlation between CD161 and infiltration level of indicated immune cells using data from ImmuCellAI database. *p < 0.05; **p < 0.01; ***p < 0.001 and ****p < 0.0001.

