Fig. 6.
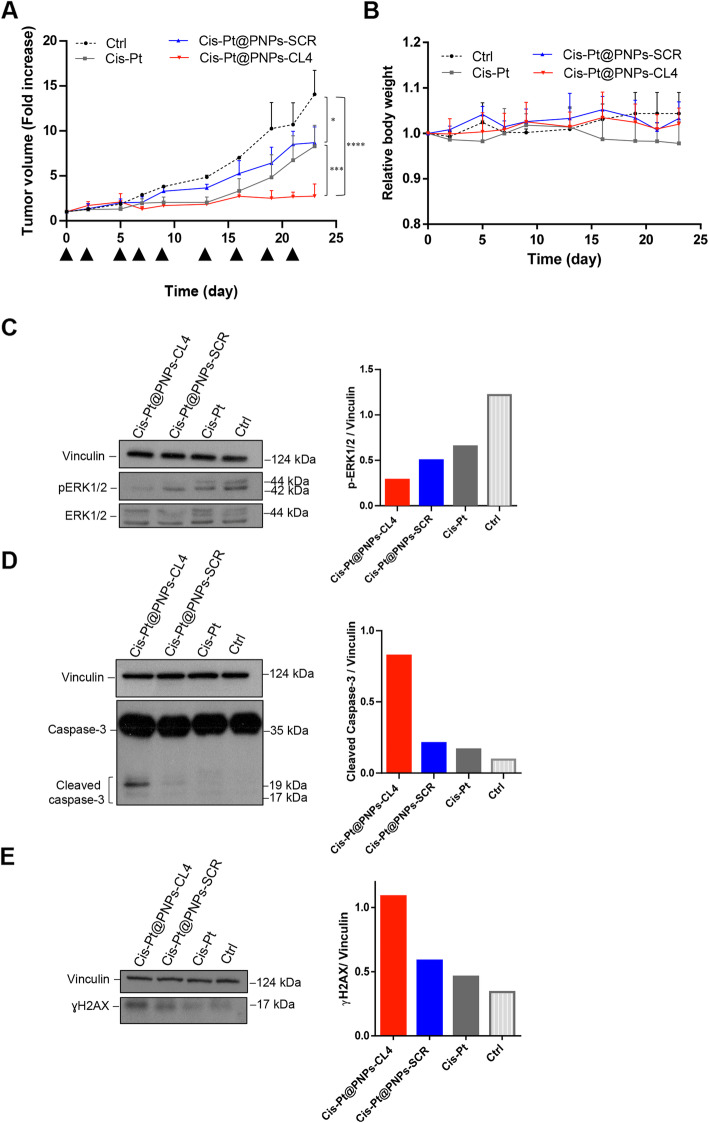
In vivo antitumor efficacy of Cis-Pt@PNPs-CL4 compared to free Cis-Pt and Cis-Pt@PNPs-SCR. Mice bearing MDA-MB-231 xenografts were injected intravenously with free Cis-Pt, Cis-Pt@PNPs-CL4 or Cis-Pt@PNPs-SCR (0.6 mg Cis-Pt/kg) at the times indicated by the head arrows. Day 0 marks the start of treatments. Mice treated with DPBS were used as the control group (Ctrl). (a) Tumor growth was monitored by calipers over time and experimental raw data (expressed as fold change) were interpolated with no curve fitting or regression analysis. Each point represents the mean ± SD of five mice. ****P < 0.0001, ***P < 0.001, *P < 0.05. (b) Body weight changes in mice of each group at the indicated days. The results represent the means ± SD (n = 5). (c-e) Immunoblot with anti-pERK1/2 and ERK1/2 (c), anti-caspase-3 (d) and anti-γH2AX (e) antibodies of pooled lysates from recovered tumors (n = 5). Vinculin was used as an internal control. The histograms indicate pERK1/2/vinculin (c), cleaved caspase-3/vinculin (d) and γH2AX/vinculin (e) ratio of densitometric signals. Depicted results represent one of three typical experiments performed. Molecular weights of indicated proteins are reported

