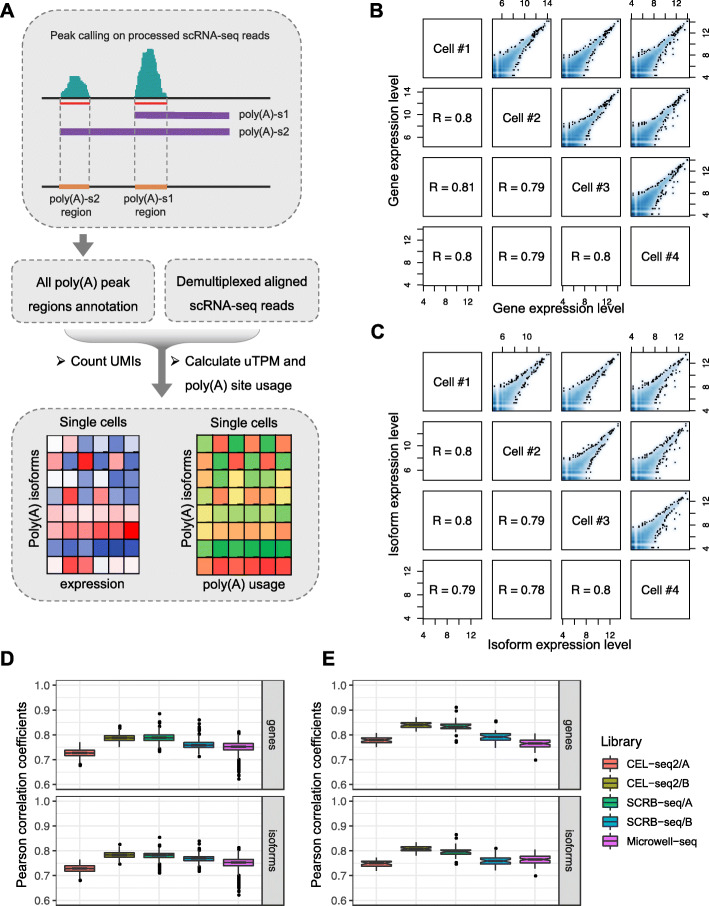
Fig. 2.
Quantification of poly(A) site usage using 3′-tag-based scRNA-seq data. a Schematic illustration of SAPAS to quantify poly(A) site usage using 3′-tag-based scRNA-seq data. b The smooth scatterplots pairwise comparing gene expression level of four randomly selected single cells from SCRB-seq/A dataset. The lower left indicates the Pearson correlation coefficients (R) for each comparison. c The smooth scatterplots pairwise comparing poly(A) isoform expression level of 4 randomly selected single cells from SCRB-seq/A dataset. The lower left indicates the Pearson correlation coefficients (R) for each comparison. d The boxplots depict the distributions of pairwise Pearson correlation coefficients of the expression level estimated in five different scRNA-seq datasets. The upper boxplot is for gene expression level and the lower boxplot is for poly(A) isoform expression level. Different datasets are represented in different colors as shown. e The boxplots depict the distributions of Pearson correlation coefficients of expression level between each single cell and pooled single-cell data. The upper boxplot is for gene expression level and the lower boxplot is for poly(A) isoform expression level. Different datasets are represented in different colors as shown

