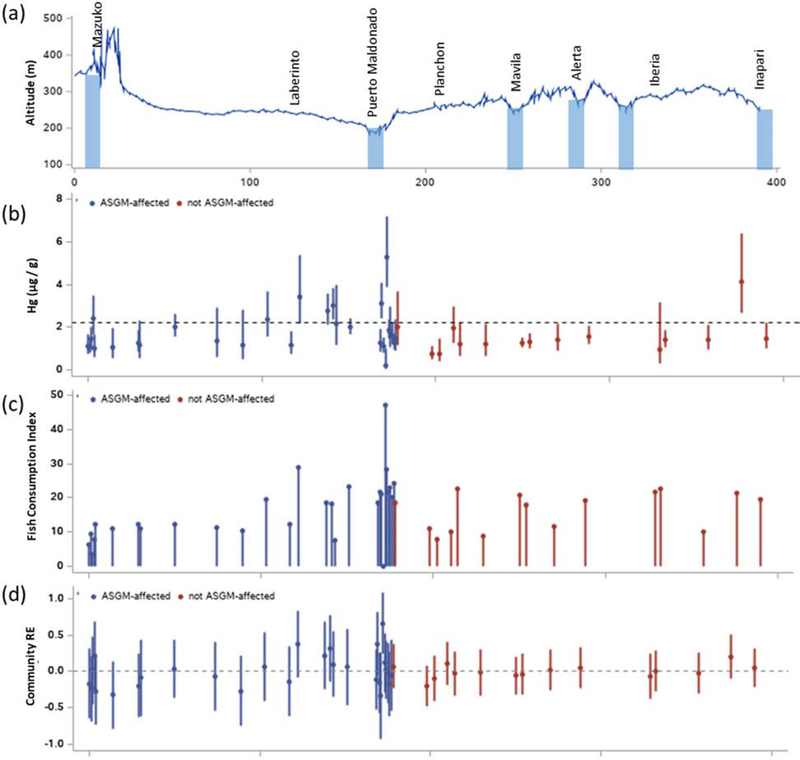
Figure 2.
Distribution of community location along the highway by hair total mercury (μg/g), fish consumption index, and community variation. The x-axis for all graphs is the relative distance (in km) of each community along the highway, starting with the most western community in the study. Figure 2a shows the road altitude, location of select communities and location of all rivers that cross the highway (in blue vertical bars); Figure 2b shows the average H-THg and 95% confidence interval (CI) by community along the highway; Figure 2c is average fish consumption index level by community along the highway; and Figure 2d is the community random intercept and 95% CI from an intercept-only model that partitions variance among individuals, households and communities. Communities located in ASGM affected watershed are denoted in blue while those in non-ASGM-affected watershed are denoted in brown.

