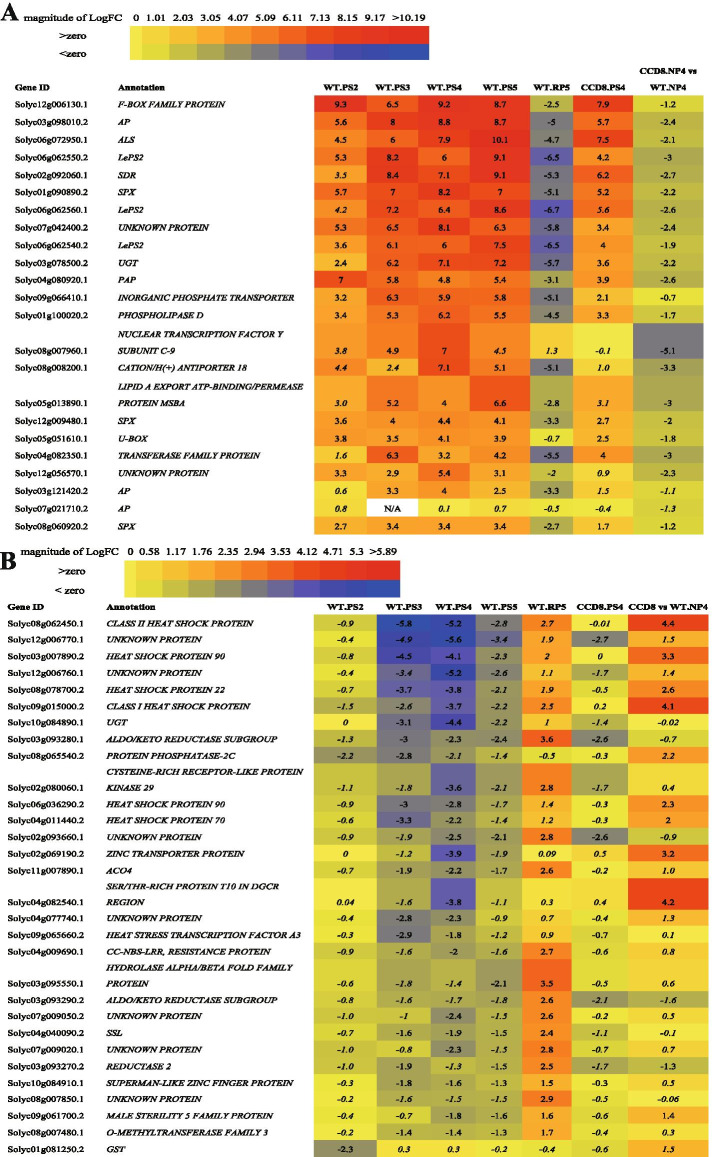
Fig. 4.
Heatmaps showing a selection of strongest induced and repressed DEGs in the roots of WT tomato and CCD8 RNAi line at different P starvation treatment times. A, the log2FC of the top 10 strongest P starvation-induced DEGS (at 2, 3, 4 and 5 days of P starvation) and their repression by P replenishment in WT, and DEGs at 4 days of P starvation in CCD8 RNAi line. B, the log2FC of the top 10 most repressed P starvation-induced DEGs (at 2, 3, 4 and 5 days of P starvation) and their upregulation by P replenishment in WT and CCD8 RNAi line. The heatmaps show expression profiles of the top 10 most induced/repressed P starvation DEGs; Values (in A and B) in italics represent the adjusted P-value < 0.05

