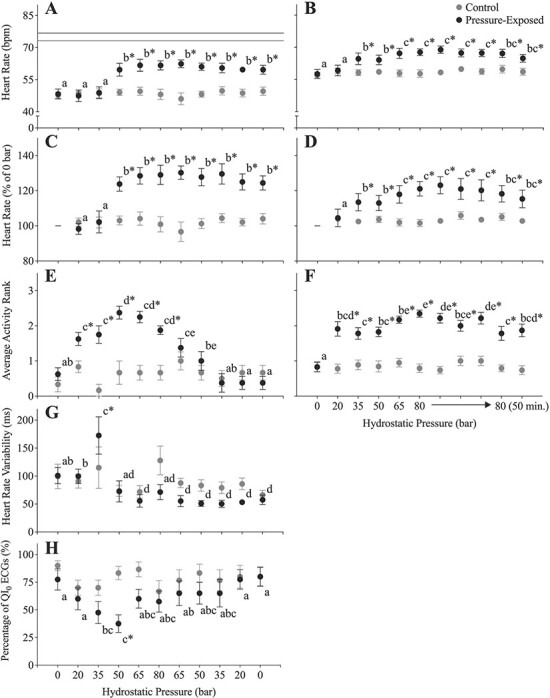
Figure 3.

Lumpfish were held in the IPOCAMP at atmospheric pressure (0 bar, grey symbols) or exposed to hydrostatic pressure in a step-wise protocol (black symbols). Pressure was initially increased to 20 bar over 2 minutes, then held for 8 minutes. Pressure was then increased in a similar manner to 35, 50, 65 and 80 bar, followed by decompression in the opposite sequence (A, C, E, G, H; controls and 8 pressure exposed) or held at 80 bar for 1 hour (B, D, F; 19 controls and 23 pressure exposed). Heart rate (fH in bpm; A and B), the percentage change in fH (as a % of resting values at 0 bar; C and D) and HRV (in ms; G) were manually calculated from ECGs and the percentage of QI0 ECGs (H) were provided by the Star-Oddi Mercury software. The average activity rank (E and F) was determined from video recordings; where 0 represents fish that were completely inactive, 1 represents fish that were mostly inactive but had some spontaneous activity, 2 represents fish that were mostly active but had some periods of inactivity and 3 represents fish that were active for the entire 10-minute period. Maximum fH post-chase following removal from the IPOCAMP is represented as a grey (control; n = 4) or line in panel A. Dissimilar lower-case letters indicate a significant difference within the pressure-exposed group (no differences existed in the control group), while an asterisk indicates a significant difference (P < 0.05) between the pressure-exposed and control groups at a particular pressure step. Data were recorded every 2 minutes and the symbols represent means ± S.E.M (5 per fish).
