
Figure 4.
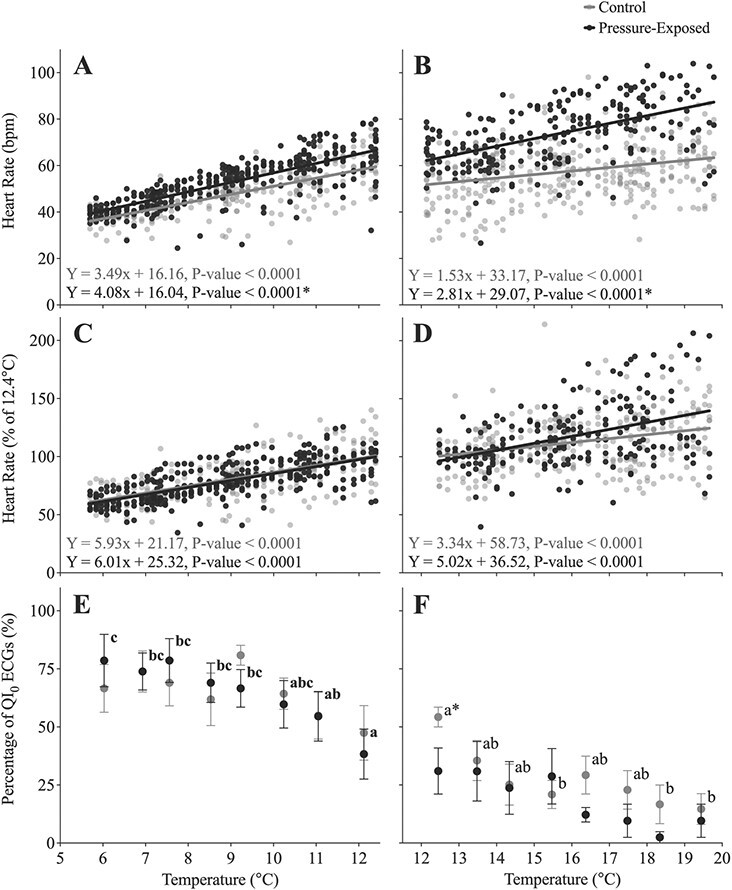
Lumpfish held at atmospheric pressure (grey symbols; 7 per experiment) or exposed to 80 bar of pressure (black symbols; 7 per experiment) were exposed to decreasing (at 2°C h−1; A, C, E) or increasing (at 2°C h−1; B, D, F) temperature in the IPOCAMP chamber. Heart rate (fH in bpm; A and B) and the percentage change in fH (as a % of resting values at 0 or 80 bar; C and D) were manually calculated from the ECGs. An asterisk indicates a significant difference between the slopes for relationships between control and pressure-exposed groups. The percentage of QI0 ECGs (E and F) was provided by the Star-Oddi Mercury software. In these panels, significant differences within the control (regular letters) or pressure-exposed groups (bold letters) are represented by dissimilar lower-case letters and an asterisk indicates a significant difference (P < 0.05) between the pressure-exposed and control groups at a particular temperature step. Data were recorded every 5 minutes, and the symbols represent means ± S.E.M (6 values per fish).