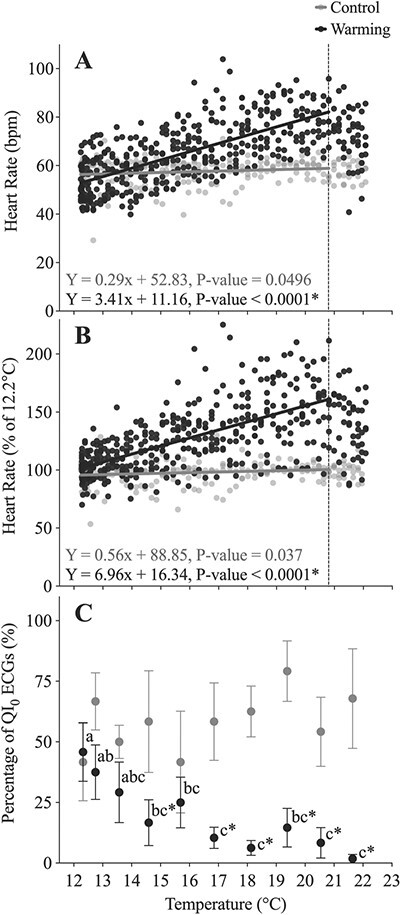
Figure 6.

(A) Heart rate (fH, bpm) and (B) the percentage change in fH (as a % of initial values at 12.2°C) in lumpfish during an acute warming protocol (black symbols; n = 12) in a water table, where temperature was increased at 2°C h−1 vs. when fish were held at a constant temperature of 12°C (grey symbols; n = 4). An asterisk indicates a significant difference (P < 0.05) in the slopes between control fish and those exposed to increasing temperature. (C) The percentage of QI0 ECGs was provided by the Star-Oddi Mercury software. In this panel, significant differences within the warming group (there were no differences in the control group) are represented by dissimilar lower-case letters, and an asterisk represents a difference between the warming and control group at a particular temperature. Data were recorded every 5 minutes, and the symbols represent means ± S.E.M (6 per fish). The dotted line indicates the temperature of 20.8°C. Beyond this temperature the fH of the lumpfish began to decrease, and thus, these data were not included in the linear regression.
